


![]()
To find out more about Rock-Eval®
• Analytical method
• Analytical method details
• Interpretation for oil exploration
• Literature
Analytical method
Different analytical methods are recommended depending on the application field:
- Oil exploration and production: three analytical methods are recommended: the « Bulk Rock » method dedicated more particularly to conventional source rock samples, the « Reservoir » method dedicated to reservoir rock samples, and the « Shale Play » method, dedicated to the characterization of source rock hydrocarbons and useful for the study of rocks contaminated by drilling muds.
- Oil products: the « Reservoir » method is recommended.
- Sedimentary geochemistry: the « Bulk Rock » method is the most widely employed analytical method for sedimentary rocks and recent sediments (Baudin et al., 2015).
- Hydrocarbon-contaminated soils: the analytical method developed by Ducreux et al. (1997) is recommended for the analysis of contaminated soils. With several heating rates and temperature ranges, it makes it possible to distinguish the lighter oil cuts from the heavier ones, via the vaporization of the former and thermal cracking of the latter.
- Soil Organic Matter: the method proposed by Disnar et al. (2003) was derived from the « Bulk Rock » method to optimize the characterization of soil organic matter and is recommended to this end.
- Geothermal energy : the « Shale Play » method can be used for the characterization of samples of various types, such as:
- solid deposits present in exchangers,
- lubricants used in geothermal facilities,
- corrosion inhibitors intended to protect geothermal facilities (Romero-Sarmiento & Ravelojaona, 2019).
Analytical method details
1. The « Bulk Rock » method is described, for example, in Lafargue et al. (1998) and Behar et al. (2001). The temperature sequence for this method is generally characterized by an initial pyrolysis oven temperature of 300°C, a temperature that is kept constant for a pre-determined period of 3 minutes. It is during this phase that free hydrocarbons, initially contained in the rock sample, are released. Their quantity is estimated by measuring the surface area of a first peak, denoted S1, using a flame ionization detector. Then, the pyrolysis temperature is gradually increased until it reaches a temperature of 650°C in general. During this phase, the volatilization of the heavier hydrocarbon compounds and the thermal hydrocracking of non-volatile organic matter take place. The quantity of hydrocarbon compounds released during this phase is estimated by measuring the surface area of a second peak, denoted S2.
2. The « Reservoir » method, dedicated more particularly to oil and reservoir rock samples. The temperature sequence for the “Reservoir” method is characterized by an initial pyrolysis oven temperature preferably equal to 180°C. This temperature is maintained for a pre-determined period of 10 minutes during which light hydrocarbon compounds are volatilized. Their quantity is calculated my measuring the surface area of a first peak, denoted S1r, detected by the flame ionization detector. The temperature of the pyrolysis oven is then increased to a second temperature of 650°C. During this phase, heavier hydrocarbon compounds are either volatilized or cracked. Their quantity is calculated by measuring the surface area of two other peaks: the peak denoted S2a for a temperature of between 180 and 370°C, and the peak denoted S2b for a temperature of between 370 and 650°C.
3. The « Shale Play » method dedicated more particularly to the characterization of source rock hydrocarbons is described in Romero-Sarmiento et al. (2016a; 2016b, 2019). The temperature sequence for the “Shale Play” method is characterized by an initial pyrolysis oven temperature preferably equal to 100°C. This temperature is then raised to a second temperature of 200°C and maintained for a pre-determined period of 3 minutes; the quantity of light hydrocarbon compounds below 20 carbon atoms is estimated by measuring the surface area of a first peak, denoted Sh0. The temperature of the pyrolysis oven is then increased to a third temperature of 350°C. During this phase, the quantity of heavier hydrocarbon compounds released is estimated via the estimation of the surface area of a second peak, denoted Sh1. This phase corresponds closely to the end of the thermovaporization of some hydrocarbons and the start of cracking by pyrolysis of the heavy compounds. Then the pyrolysis temperature is increased once again until it reaches a fourth temperature, generally 650°C. The surface area of a third peak, denoted Sh2, representative of hydrocarbons derived from the thermal cracking of kerogen, is estimated during this third heating phase.
4. With the analytical method dedicated to hydrocarbon-contaminated soils, the soil sample is first pyrolyzed at an initial temperature of 80°C, then it is gradually pyrolyzed up to a temperature of 120°C at a rate of 5°C/min, then up to 350°C at a rate of 15°C/min. The final temperature of 650°C is reached at a rate of 25°C/min. This temperature program enables the step-by-step release of different oil cuts present in the soil sample and their identification: gasoline, kerosene, diesel, lubricating oils, poly aromatic hydrocarbons, coal tar, etc.
Interpretation for oil exploration
In the field of oil exploration, different parameters and indices from the Rock-Eval® analysis are interpreted for the evaluation of source rocks as well as oil and gas reserves.
The “Bulk Rock” method gives access to the organic carbon content (TOC) and mineral carbon content (MinC), as well as miscellaneous indices used for oil exploration (S2, Tmax, HI, OI, SI, PI):
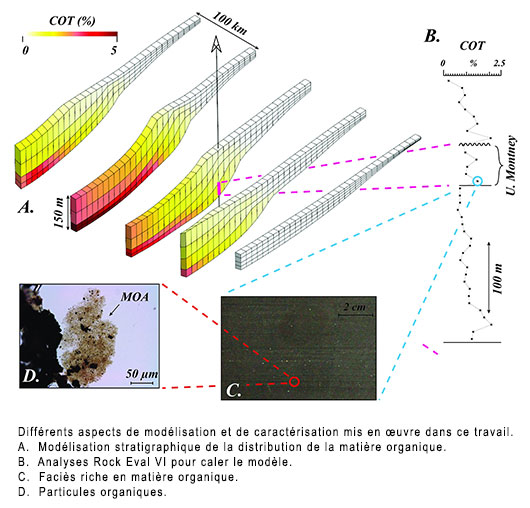
• The COT parameter, representing the rock’s total organic carbon content, is expressed in grams of organic carbon per gram of sample x 100 (mass percentage). It is a fundamental parameter, being the first target property to be quantified when evaluating a rock’s organic matter concentration. In the field of oil exploration it indicates the presence of a potential source rock and its richness.
• The MinC parameter, representing mineral carbon content, is expressed in grams of mineral carbon per gram of sample x 100 (mass percentage). It can be translated into calcite (CaCO3) equivalent by applying the following formula:
Calcite equivalent = MinC /12 x (12 +3x16 +40) (g calcite eq./g rock x 100)
• The S2 parameter corresponds to the hydrocarbons released by the organic matter (kerogen) during pyrolysis between 300°C and 400°C and is expressed in milligrams of hydrocarbons per gram of rock. In terms of geological conditions, it represents the quantity of hydrocarbon compounds that would have been generated by the source rock if it had been heated to a sufficient temperature for long enough for its organic matter to crack and generate hydrocarbons. In oil exploration this parameter is referred to as “oil potential” (Espitalié et al. 1977).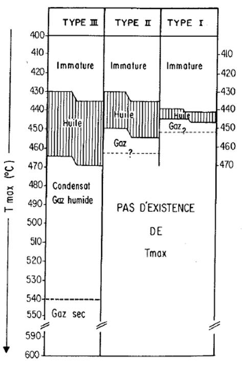
• The Tmax parameter, a linear function of the S2 peak maximum temperature, is expressed in degrees Celsius. In oil exploration, it is interpreted in terms of the level of thermal maturity of the source rock’s organic matter and, in practice, is used to determine oil and gas production zones (Espitalié et al. 1985[b]).
• The HI (Hydrogen Index) is the ratio between S2 and TOC and is expressed in milligrams of hydrocarbons per gram of organic carbon x 100:
HI = S2 /TOC x 100
• The OI (Oxygen Index) is the ratio between S3 and TOC and is expressed in milligrams of CO2 per gram of organic carbon x 100:
OI = S3 /TOC x 100
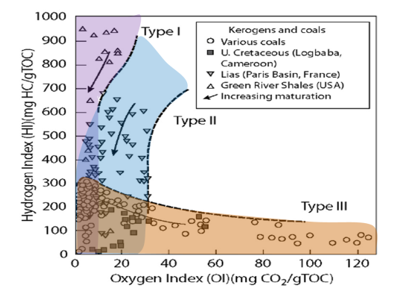
In oil exploration, the HI and OI values are proxies of, respectively, the hydrogen and oxygen contained in the kerogen fraction capable of generating oil and gas. These are useful parameters because the higher the hydrogen content of a kerogen the greater its capacity to generate high-quality oil. Moreover, an immature hydrogen-rich kerogen is generally derived from algae and microorganisms living in fresh water. In contrast, the higher the oxygen content of a kerogen, the lower its capacity to generate oil and the poorer the quality of the oil generated. Moreover, an immature oxygen-rich kerogen is often derived from higher terrestrial plants. Kerogens with intermediate hydrogen and oxygen contents, on the other hand, are often derived from marine algae and microorganisms. Accordingly, it is possible to establish graphical plots of kerogens according to their origin, without the need to chemically extract them from the rock, by simply using a diagram (HI, OI) generated by a Rock-Eval® analysis of the bulk rock. This diagram has been known as a “pseudo-Van Krevelen” diagram, after the chemist who developed it.
In addition, an HI-Tmax diagram can be used to interpret the maturity of kerogen as a function of its type. Lastly, an S2-TOC diagram provides additional information concerning kerogen families within the same type. All three diagrams are widely used in oil exploration.
• The SI (Sulfur Index) is only obtained with version 7S of the Rock-Eval® technology. It is defined as the ratio between S2orgS, which quantifies the sulfur released by organic matter during pyrolysis between 300°C and 400°C, and TOC. It is expressed in milligrams of SO2 per gram of organic carbon x 100:
SI = S2orgS /TOC x 100
This index is a proxy of the sulfur contained by the kerogen fraction capable of generating oil and gas. It is useful due to the fact that a sulfur-containing kerogen generally cracks at a lower temperature than a non-sulfur-containing kerogen. Moreover, it tends to generate a sulfur-rich oil, which is of lower quality than oil containing no sulfur.
• The PI (Production Index) is the ratio between S1 and S1+ S2 and is expressed in grams per gram of hydrocarbons x 100:
PI = S1 / (S1+S2) x 100
This parameter characterizes the state of evolution of rock organic matter by providing an indication of the quantity of hydrocarbons still present in the source rock (S1), relative to the pyrolyzable organic matter of this rock (S2). Since S1 comes from S2, S1 increases as S2 reduces if the system remains closed. Based on this principle, the production index also makes it possible to define the levels of the source rock from which oil (S1) has been expelled to drainage rocks, in the case of an open system. The PI ranges between 5% for immature source rocks and 60 - 100% for very mature source rocks.
In the specific field of hydrocarbon-rich source rocks, the "Shale Play” method gives access to parameters used for oil exploration (HCcont, HQI and PIshale):
• The Hydrocarbon Content parameter (HCcont) is calculated from Sh0 and Sh1 signals obtained at between 100°C and 350°C and is expressed in milligrams of hydrocarbons per gram of rock:
HCcont = Sh0 + Sh1
It corresponds to the quantity of thermovaporized hydrocarbons and thus provides an estimate of the total free and adsorbed hydrocarbons present in the rock.
• The HQI parameter (Hydrocarbon Quality Index) is also calculated from Sh0 and Sh1 signals obtained at between 100°C and 350°C and is expressed in terms of mass percentage:
HQI = Sh0 /(Sh0+Sh1) X 100
It represents the lightest hydrocarbon fraction (Sh0) relative to total free and adsorbed hydrocarbons (Sh0+Sh1) present in the rock. Since the lightest hydrocarbons are those with the highest value, this index thus evaluates the quality of hydrocarbons in the rock intervals analyzed.
• The PIShale parameter (Production Index for source rocks that are rich in liquid hydrocarbons) is calculated from the three Sh0, Sh1 and Sh2 signals as follows and is expressed in terms of percentage mass:
PIShale = (Sh0+Sh1) / (Sh0+Sh1+Sh2) x 100
It represents the fraction of total free and adsorbed hydrocarbons (Sh0+ Sh1) relative to all free and adsorbed hydrocarbons (Sh0+Sh1) and to generated hydrocarbons by cracking (Sh2). Its value lies in being able to identify oil sections of interest in a source rock-reservoir unit.
Literature
• Aboussou Anabel, 2018, PhD thesis, Sorbonne University, “New Rock-Eval method for Pyritic and Organic Sulphur quantification: Application to study Organic Matter preservation in Jurassic sediments”.
• Albrecht, R., Sebag, D., Verrecchia, E., 2015. Organic matter decomposition: bridging the gap between Rock–Eval pyrolysis and chemical characterization (CPMAS 13C NMR). Biogeochemistry 122, 101–111. https://doi.org/10.1007/s10533-014-0033-8.
• Barré, P., Plante, A.F., Cécillon, L., Lutfalla, S., Baudin, F., et al. 2016. The energetic and chemical signatures of persistent soilorganic matter. Biogeochemistry 130, 1–12. https://doi.org/10.1007/s10533-016-0246-0.
• Baudin F., Disnar J.R., Aboussou A., Savignac F. 2015, Guidelines for Rock–Eval analysis of recent marine sediments, Organic Geochemistry 86 (2015) 71–80
• Behar, F., Beaumont, V., De B. Penteado, H. L., 2001, Rock-Eval 6 Technology: Performances and Developments. Oil & Gas Science and Technology 56, 111-134.
• Benoit Y., Dalmazzone C., Audibert-Hayet A., 2002, Pollut-Eval: an innovative tool for direct hydrocarbon characterization in oil base mud & cuttings., SPE 77472, paper presented at the SPE Annual Technical Conference and Exhibition held in San Antonio, Texas, 29 September–2 October 2002.
• Carrie J., Sanei H., Stern G., 2012, Standardization of Rock–Eval pyrolysis for the analysis of recent sediments and soils, Organic Geochemistry 46 (2012) 38–53, doi:10.1016/j.orggeochem.2012.01.011
• Carvajal-Ortiz H. and Gentzis T., 2018, Geochemical screening of source rocks and reservoirs: The importance of using the proper analytical program, International Journal of Coal Geology 190 (2018) 56–69
• Cécillon L., Baudin F.,Chenu C., Houot S., Jolivet R., et al. 2018, A model based on Rock-Eval thermal analysis to quantify the size of the centennially persistent organic carbon pool in temperate soils, Soil Biology and Biochemistry, Volume 117, February 2018, Pages 117-124
• Derenne, S., Quenea, K., 2015. Analytical pyrolysis as a tool to probe soil organic matter. J. Anal. Appl. Pyrolysis 111, 108–120. https://doi.org/10.1016/j.jaap.2014.12.001.
• Disnar, J.R., Guillet, B., Keravis, D., Di-Giovanni, C., Sebag, D., 2003. Soil organic matter (SOM) characterization by Rock-Eval pyrolysis: scope and limitations. Organic Geochemistry 34, 327–343.
• Ducreux J. ; Lafargue E.; Bocard C.; Marquis F.; Pillot D. 1997. « Use of the Rock-Eval method for assessment of oil-contamined soils: Pollut-Eval analyzer.” 1er congrès “Field screening Europe, International conference- Strategies and techniques for the investigation and monitoring of contaminated sites”, Karlsruhe, Sep. 29-Oct. 1 1997, Proceedings, J. Gottli, Kluwer Academic Publishers 1997
• J. Espitalie, M. Madec, B. Tissot, J. Menning, P. Leplat: Source rock characterization methods for petroleum exploration. Proceedings of the Offshore Technology Conference 1977, Volume III. S. 439–44.
• Espitalié, J., Laporte, J.L., Madec, M., Marquis, F., Leplat, P., et al., 1977. Méthode rapide de caractérisation des roches mères, de leur potentiel pétrolier et de leur degré d’évolution. Oil and Gas Science and Technology 32, 23–42
• Espitalié, J., Deroo, G., Marquis, F. 1985[a]. « La pyrolyse Rock-Eval et ses applications – Première partie". Revue de l’Institut Français du Pétrole, vol.40, n°5, pp.563-579.
• Espitalié, J., Deroo, G., Marquis, F. 1985[b]. « La pyrolyse Rock-Eval et ses applications – Deuxième partie". Revue de l’Institut Français du Pétrole, vol.40, n°6, pp.755-784.
• Espitalié, J., Deroo, G., Marquis, F. 1986. « La pyrolyse Rock-Eval et ses applications – Troisième partie". Revue de l’Institut Français du Pétrole, vol.41, n°1, pp.73-89.
• Feller, C., Brossard, M., Chen, Y., Landa, E.R., Trichet, J., 2010. Selected pioneering works on humus in soils and sediments during the 20th century: a retrospective look from the International Humic Substances Society view. Phys. Chem. Earth Parts ABC, Studies from the History of Soil Science and Geology 35, 903–912. https://doi.org/ 10.1016/j.pce.2010.10.004.
• Lafargue, E., Marquis, F., Pillot, D. (1998). Rock-Eval 6 applications in hydrocarbon exploration, production, and soil contamination studies. Oil & Gas Science and Technology - Rev. IFP 53, 421-437.
• Lamoureux-Var V., Espitalié J, Pillot D., Bouton N. 2019. Rock-Eval® 7S : Technology and Performance, 29th International Meeting on Organic Geochemistry, 1-6 September 2019, Gothenburg, Sweden
• Langford, F.F. and Blanc-Valleron, M.-M. 1990 Interpreting Rock-Eval Pyrolysis Data Using Graphs of Pyrolizable Hydrocarbons vs. Total Organic Carbon (1). AAPG Bulletin, 74, 799-804.
• Matteodo, M., Grand, S., Sebag, D., Rowley, M.C., Vittoz, P., Verrecchia, E.P., 2018. Decoupling of topsoil and subsoil controls on organic matter dynamics in the Swiss Alps. Geoderma 330, 41–51. https://doi.org/10.1016/j.geoderma.2018.05.011.
• Meyers, P.A., Lallier-Vergès, E., 1999. Lacustrine sedimentary organic matter records of late quaternary paleoclimates. J. Paleolimnol. 21 (3), 345–372.
• Peters K.E, 1986, « Guidelines for evaluating petroleum source rock using programmed pyrolysis. AAPG Bull. 1986;70:318–29.
• Peters KE, Cassa MR. « Applied source rock geochemistry. In: Magoon LB, Dow WG, editors. The petroleum system—from source to trap, vol. 60. AAPG Memoir; 1994, p. 93–120.
• Pillot, D., Deville, E., Prinzhofer, A., 2014. Identification and quantification of carbonates species using Rock-Eval pyrolysis. Oil and Gas Science and Technology 69, 341–349.
• Romero-Sarmiento, M.-F., Pillot, D., Letort, G., Lamoureux-Var, V., Beaumont, V., Huc, A.-Y., Garcia, B. 2016a. New Rock-Eval method for characterization of unconventional shale resource systems. Oil & Gas Science and Technology 71, 37. http://dx.doi.org/10.2516/ogst/2015007.
• Romero-Sarmiento, M.-F., Euzen T., Rohais S., Jiang C., Littke R. (2016b). Artificial thermal maturation of source rocks at different thermal maturity levels: Application to the Triassic Montney and Doig Formations in the Western Canada Sedimentary Basin. Organic Geochemistry 97: 148-162.
• Romero-Sarmiento, M.-F. A quick analytical approach to estimate both free versus sorbed hydrocarbon contents in liquid rich source rocks. AAPG Bulletin, 103: 2031-2043 (2019).
• Romero-Sarmiento & Ravelojaona (2019). Procédé pour caractériser les composés organiques hydrocarbonés contenus dans un dépôt solide d'une installation géothermique : Rock-Eval® pour caractériser des dépôts solides en géothermie. IFPEN patent 19/0337.
• Scheeder G., Weniger P., Blumenberg M., 2020, Geochemical implications from direct Rock-Eval pyrolysis of petroleum, Organic Geochemistry 146 (2020) 104051, https://doi.org/10.1016/j.orggeochem.2020.104051
• Sebag, D., Verrecchia, E.P., Cecillon, L., Adatte, T., Albrecht, R., Aubert, M., Bureau, F., Cailleau, G., Copard, Y., Decaens, T., Disnar, J.-R., Hetenyi, M., Nyilas, T., Trombino, L., 2016. Dynamics of soil organic matter based on new Rock-Eval indices. Geoderma 284, 185–203. https://doi.org/10.1016/j.geoderma.2016.08.025.
• Soucemarianadin, L., Cecillon, L., Chenu, C., Baudin, F., Nicolas, M., Girardin, C., Barre, P., 2018. Is Rock-Eval 6 thermal analysis a good indicator of soil organic carbon lability? – a method-comparison study in forest soils. Soil Biol. Biochem. 117, 108–116. https://doi.org/10.1016/j.soilbio.2017.10.025.
• Tissot B. P et Welte D. H., 1984, « Petroleum Formation and Occurrence, Second Revised and Enlarged Edition, Springer-Verlag Berlin Heidelberg NewYork Tokyo 1984, 699 p.
• Trabelsi, K., Espitalié, J., Huc, A.-Y. (1994). Characterization of Extra Heavy Oils and Tar Deposits by modified Pyrolysis Methods. Proceedings of the « Heavy Oil Technologies in a Wider Europe » Thermic EC Symposium, Berlin 1994, 30-40.
• Wattripont A., Baudin F., de Rafelisa M., Deconinck, J.F. 2019, Specifications for carbonate content quantification in recent marine sediments using Rock-Eval pyrolysis, Journal of Analytical and Applied Pyrolysis, Volume 140, June 2019, Pages 393-403
You may also be interested in
Rock-Eval® : Thermal analysis of rocks and soils
Rock-Eval® : history of a process, applications, the method
Rock-Eval® 7 Sulfur: calibration and verification
Table presenting reference materials, Reference values, Analytical methods