07.10.2019
15 minutes of reading


Biofuels in the road transport sector
Global energy consumption in the road transport sector currently amounts to almost 2.1 Gtoe/year (Fig.1). In 2017, alternatives to oil-based gasoline and diesel fuels represented 7.7% of overall fuel consumption. Although their quantity increased from 158.6 Mtoe to 161.1 Mtoe between 2016 and 2017, their penetration rate remained stable at 7.7%. Among these alternatives (biofuels, LPG, NGV, electricity), biofuels represented 79.6 Mtoe. Their consumption increased by around 3% between 2016 and 2017. At the same time, the demand for road fuel increased by 1.5%, similar to the rise seen between 2015 and 2016 (+1.8%).
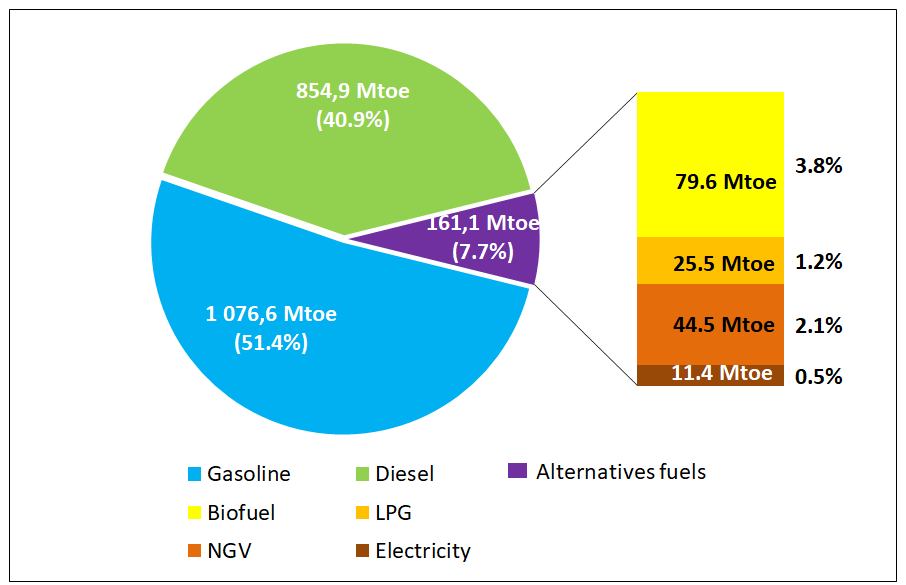
Source: IFPEN, from Enerdata and FO Licht
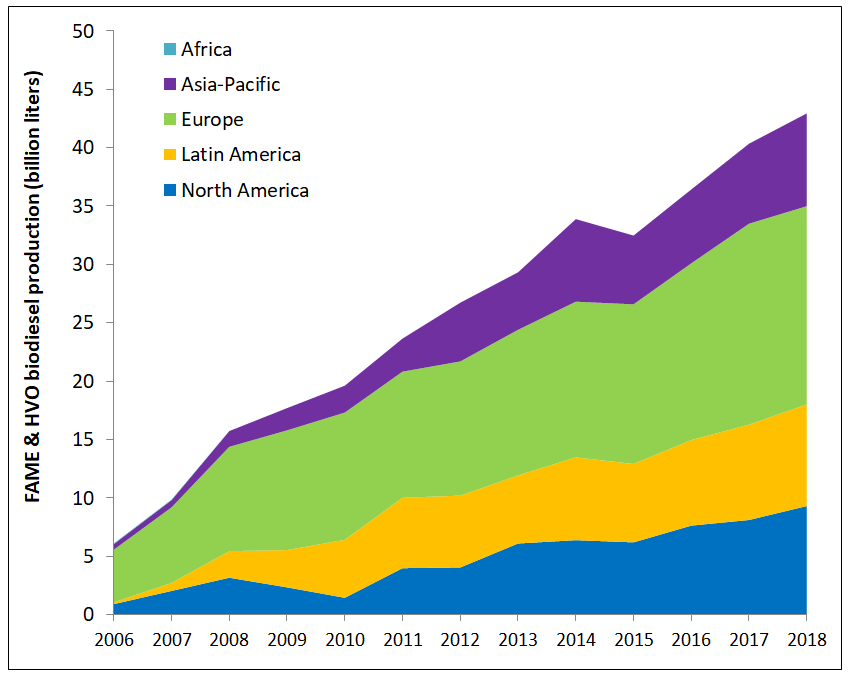
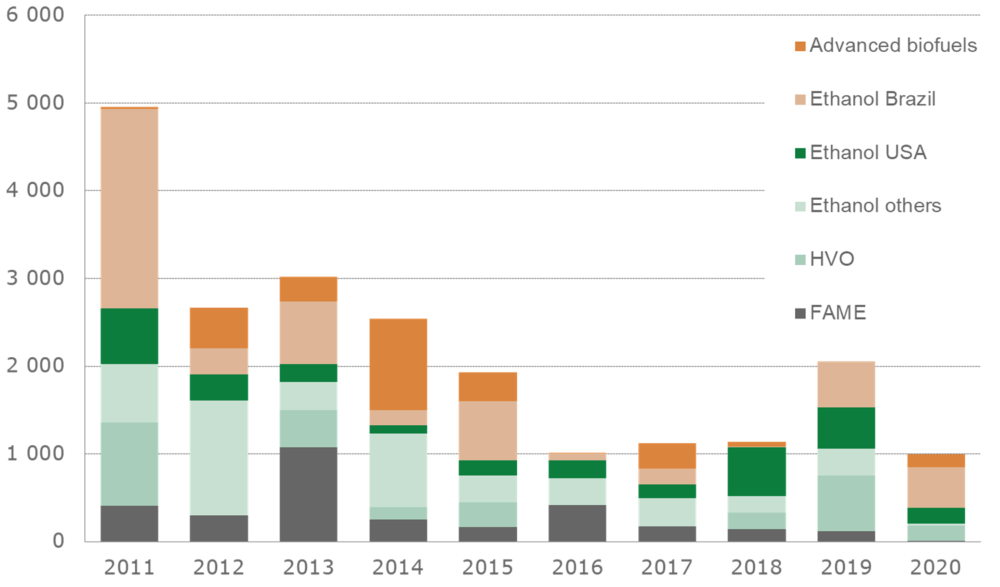
Throughout the world, the volume of biofuel consumed in the transport sector has been increasing constantly since 2011 (Fig. 2). While the growth rates of ethanol and FAME (Fatty Acid Methyl Ester) biodiesel slowed in the 2015 2016 period, biodiesel consumption subsequently began to rise again, particularly with the emergence of the HVO (Hydrotreated Vegetable Oil) market.
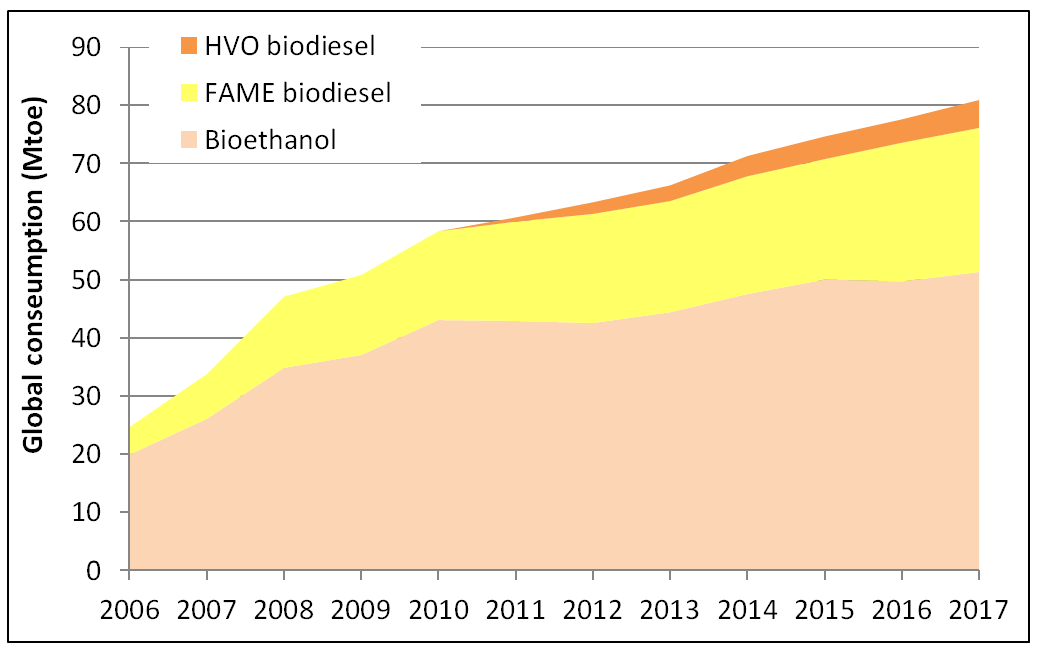
Source: IFPEN
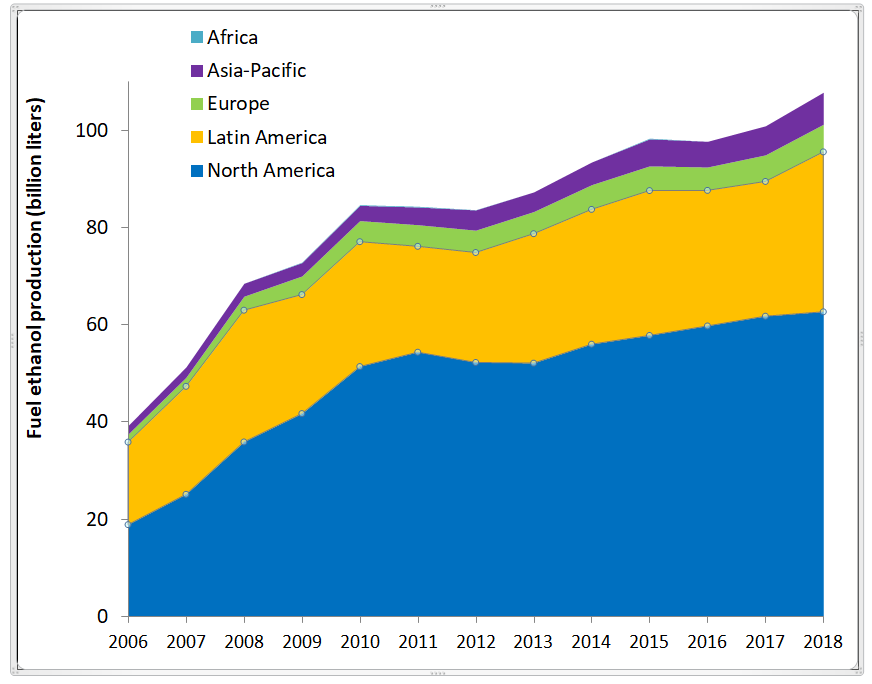
Source: IFPEN, from FO Licht
Across the continents, incorporation rates vary, with Latin America continuing to lead the field with a rate of more than 9.6% (energy), driven by its ethanol market. North America and Europe follow, with respective rates of 6.4% and 4.7% (energy). In Asia, the rate only amounts to 1.2%, but it is nevertheless a zone where investments and government policies supporting biofuels are the most extensive. In the majority of the world’s countries, particularly throughout Asia, despite incorporation rates that have remained relatively stable in recent years, the market has been developing rapidly with the growth in the demand for road fuels.
In Europe, total biofuel consumption in the road transport sector has been oscillating between 13 and 14 Mtoe since 2011, marking the slowdown in market growth across the community as well as a number of uncertainties concerning regulatory changes. In 2017, the European Union saw a return to growth of +10%, i.e., 15.5 Mtoe consumed, primarily linked to biodiesel consumption. This return to growth coincided with the agreements concerning the major priorities of the REDII directive1.
In 2017, only Finland (18.8%) and Sweden (38.6%) had already met the 2020 objective of the European Union’s RED directive2 setting a renewable target of 10% in the transport sector. Austria was close to the threshold with 9.7%. In 2017, France was still ranked 4th (9.1% incorporation3. The European average (EU28) rose from 7.2% in 2016 to 7.6% in 2017. It should be noted that Norway has proactive policies, with renewable energy rates in the transport sector already above 15%.
Gasoline substitutes
Today, ethanol continues to be the principal biofuel incorporated into the gasoline pool. Since the start of the 2000s, growth in the ethanol fuel market has been marked by an initial slowdown in the 2011-2012 period following poor sugar cane harvests in Brazil and regulatory obstacles in the USA, and, more recently in 2016, the significant fall in production in Brazil and Europe (Fig. 3).
Source: IFPEN, from FO Licht
In 2018, the USA was the world’s leading ethanol producer, accounting for more than 55% of production, followed by Brazil (28.5%). With far lower volumes (between 1.5 and 3% of the global market), China, Canada, India and Thailand completed the world’s top 6 producers. It should be pointed out that the three Asian countries mentioned alone accounted for more than 90% of the Asia-Pacific market.
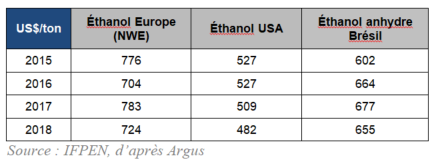
An overall reduction in the price of ethanol was seen between 2017 and 2018 (Table 1). With the increase in Chinese customs duties on American imports at the start of 2018 and the failure of RFS4 discussions relating to the widespread roll-out of E155, American ethanol stocks remained high in 2018, leading to a drop in the market price. This meant American ethanol maintained its competitive advantage.
Following a slowdown in the Brazilian ethanol market in 2017, it saw a resurgence in 2018, with a marked increase in corn-based ethanol production, with a cost price below that of sugar cane-based ethanol. Corn and sugar cane ethanols will share the expected market growth resulting from Brazil’s RenovaBio program, with operator arbitrage between the economic and environmental benefits associated with the two pathways.
In addition, poor weather conditions in 2018 had a severe impact on grain production, particularly in Europe (Russia and Ukraine included), and Australia. As a result, the harvest year will show a shortage in the countries concerned in 2019.
Diesel substitutes
Two main biofuels are currently incorporated into the road diesel pool: FAME and HVO. In EU member states, up until the end of 2017, FAME were commonly present in diesel without being specifically displayed as such to a volume of up to 7%. Since the end of 2018, the B76 and B107 labels began to appear in service stations to indicate their presence. HVO diesel - an emerging and growing market - is obtained via the hydrotreatment of fatty acids and can be incorporated without limit in conventional diesel: this is referred to as a drop-in fuel. EMAG and HVO fuels use biomass resources containing fatty acids, such as oil crops (rapeseed palm, soybean, etc.) and increasingly waste oils or animal fats.
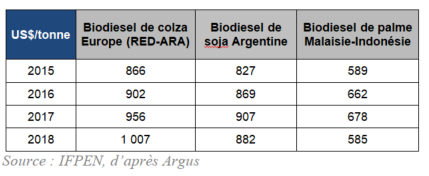
In terms of agricultural commodities markets, stocks of American soybean more than doubled between 2017 and 2018 following a record harvest. Moreover, stocks of Asian palm oil remained high, reflecting growing reticence regarding the use of palm oil, particularly in Europe. There was thus a fall in the market prices of American and Asian biodiesel (Table 2). Nevertheless, local consumption is rising, with mandates forecast to rise from 2019 and 2020. In Europe, the demand for biodiesel has increased with the growth in diesel consumption. Consumption rose from almost 13 Mtoe in 2017 to 15 Mtoe in 2018 (Fig. 4). However, the EU has been faced with a shortage of raw materials for biodiesel production causing market prices to rise and leading to a reliance on imports, with close to 3.5 Mt of FAME and more than 1.2 Mt of waste oils imported in 2018.
In terms of market dynamics, it was in Brazil and Indonesia (respectively 2nd and 4th biggest consumers nationally) that growth rates were the highest in 2018: + 45% in Indonesia and + 24% in Brazil.
Source : IFPEN, from FO Licht’s
With the global determination to improve the environmental benefits of the biodiesel sector, residual organic oils (used cooking oils, animal fats, acid oils ,, tall oil, etc.) remain the favored resource around the world (10.1 kt in 2018), ahead of soybean oil (9.7 kt) and palm oil (8,6 kt), and represent 35% of oils used in Europe, second behind rapeseed.
Focus on France
In terms of European objectives for renewable energy penetration by 2020, the French transport sector is relatively well positioned today (9.1% LHV in 2017 compared to 10% expected in 2020 taking into account multiple counts). In 2017, HVO biodiesel consumption saw the biggest increase. Today, HVO biodiesel, all of which is imported, represents 11% of total biodiesel consumption for an incorporation rate of just under 1% in the road diesel pool. The appearance of new B10, GNR308 and B100 fuel grades since 2018 may facilitate the incorporation of FAME in diesel.
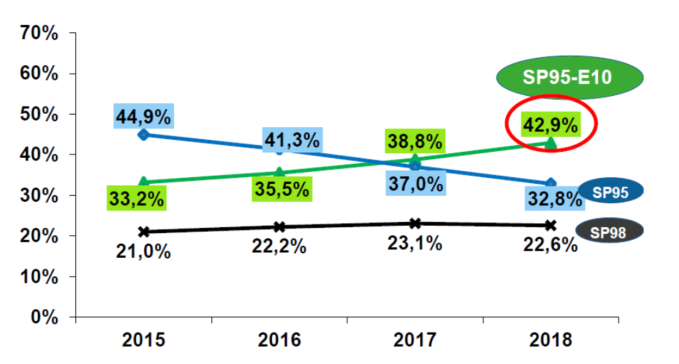
In 2017 and 2018, French road fuel consumption was marked by a 3.9% increase in gasoline consumption and fall in diesel consumption (- 3% in 2018). Since 2017, SP95-E10 fuel containing up to 10% ethanol has been the most consumed fuel by French gasoline vehicle owners, with a market share of around 43%. Indeed, in January 2019, the share exceeded 47% (Fig. 5). As for superethanol E85 (gasoline containing up to 85% ethanol), it enjoyed record growth of + 55% between 2017 and 2018. While it currently still only represents 2.6% of total gasoline consumption, it is competitively priced and is approved for seven models of conversion boxes9 enabling its use in a very broad range of standard gasoline vehicles.
Source : SNPAA 2019 from CPDC (French professional fuel distribution committee), DGDDI (French Directorate General of Customs and Indirect Taxes)
More recently, a synthetic gasoline fuel (HVHTE)10, produced using naphtha (byproduct of the HVO process), has appeared in the French gasoline pool. In 2017, it represented 11% of gasoline biofuels and an incorporation rate of close to 1% in all gasolines consumed.
In terms of the outlook, the French 2019 finance law sets out new objectives concerning an increase in the biofuel incorporation rate for France: 8.2% in the gasoline pool in 2020 and 8% in the diesel pool.
Regarding the status of palm oil, the REDII directive considers it to be a resource with a high iLUC (indirect land use change) risk and for which a considerable expansion of the production zone onto high carbon stock land is observed. For this type of resource, the directive provides for a reduction in their use in biofuels from 2023 in the European Union with a view to achieving a zero rate by 2030. With this in mind, the current French finance law specifies that from 2020 fuels produced from palm oil will no longer benefit from TIRIB11 tax exemptions (ex TGAP, general tax on polluting activities). It should be noted that 23% of the French HVHTE and biodiesel (FAME + HVO) market currently depends on palm oil.
Focus on expected investments
While the amount of investment in the biofuel sector remained relatively stable between 2016 and 2018, the nature of investments evolved, shifting towards advanced technologies in 2017, and then to the American ethanol market in 2018, particularly in response to an increasing demand from Asia (Fig. 6).
Source : from F.O. Licht’s, June 2019
For 2019, the majority of investments expected relate to the commissioning of new HVO units. Investments in the ethanol sector in the USA and Brazil are also set to increase, reflecting the ambitious development objectives for the Brazilian (RenovaBio program) and Asian markets.
While little investment is currently seen in advanced technologies for 2019, several are about to reach industrial maturity. Such is the case with the French Futurol™ project, for the production of lignocellulosic ethanol, and the BioTfueL® project, for the production of cellulosic synthetic biodiesel and biokerosene, both of which are capable of proposing fuels offering considerable environmental benefits (GHGs and particles, in particular) and that do not compete with food uses. Moreover, these technologies will contribute to the attainment of the 3.5% target objective for the incorporation of advanced biofuels in each of the EU Member States by 2030, an objective fixed in the most recent version of the European Renewable Energies directive (REDII). They may also help achieve the CO2 emissions reduction objectives in the aviation sector, the associated conditions and means of which are currently being defined on an international level and in France12.
Concrete and long-term government incentive measures are currently expected to facilitate the industrial roll-out of these technologies, such as a dedicated tax regime or vehicle CO2 emission standards13 taking into account fuel life cycle rather than exhaust emissions alone.
Daphné Lorne - daphne.lorne@ifpen.fr
Anne Bouter - anne.bouter@ifpen.fr
Draft submitted in July 2019
(1) Directive (EU) 2018/2001 (recast)
(2) Directive 2009/28/EC relating to the promotion of the use of energy produced from renewable sources
(3) Incorporation rate taking into account multiple counts
(4) Renewable Fuel Standard
5) E15: gasoline containing up to 15% ethanol
(6) B7: diesel containing up to 7% FAME biodiesel in volume
(7) B10: diesel containing up to 10% FAME biodiesel in volume
(8) GNR30: non-road diesel containing up to 30% FAME biodiesel
(9) https://www.bioethanolcarburant.com/boitiers-bioethanol-rouler-facilement-au-superethanol-e85/
(10) HVHTE: Huiles végétales hydrogénées de type essence (hydrogenated gasoline-type vegetable oils)
(11) TIRIB: Taxe incitative relative à l'incorporation de biocarburants (French incentive tax relating to the incorporation of biofuels)
(12) See full report on: https://www.ifpenergiesnouvelles.fr/enjeux-et-prospective/decryptages/energies-renouvelables/quel-avenir-les-biocarburants
(13) Recast of regulations (EC) No. 443/2009 and 510/2011 of the European Parliament and of the Council: https://data.consilium.europa.eu/doc/document/PE-6-2019-INIT/fr/pdf
You may also be interested in