

01.07.2018
30 minutes of reading


Developing biomethane as a substitute for natural gas is being considered by France for tackling several issues: lowering its CO2 emissions, mitigating its energy dependence while creating jobs. The proposed analysis aims at quantifying the positive impacts of such a development on CO2 emissions as well as on natural gas imports. It also estimates the impacts on the “gas bill” and the amount of subsidies needed to support the biomethane related industrial sectors. Modest prior to 2030, beyond that date the amount of these subsidies depends on how much biomethane is going to deploy and which industrial sectors are being considered.
The present analysis aims at estimating the orders of magnitude of a biomethane development based on four indicators: CO2 emissions, gas imports, the national gas bill (excluding network costs) and the amount of subsidies. Other important criteria such as investment levels, network deployment, net jobs created and the effects on the economic growth are not addressed in this study.
Scenarios for natural gas and biomethane demand
Two scenarios for biomethane growth are reviewed, one concerning a biomethane generated through methanization alone, the second based on a biomethane production combining methanization, biomass pyro-gasification and power to gas via methanation (Appendix 1). A reference scenario without biomethane production is used as a baseline.
The two scenarios concerning the production of biomethane are:
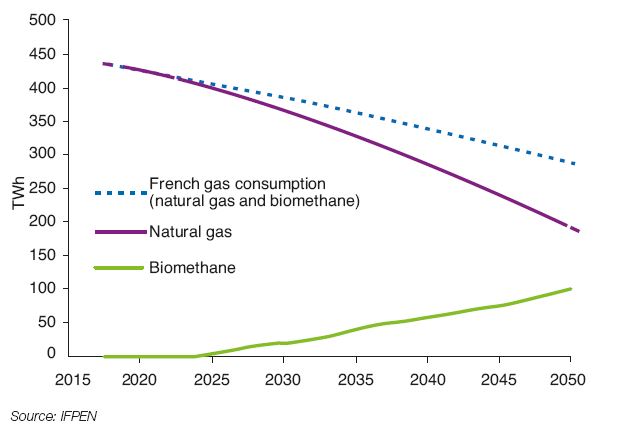
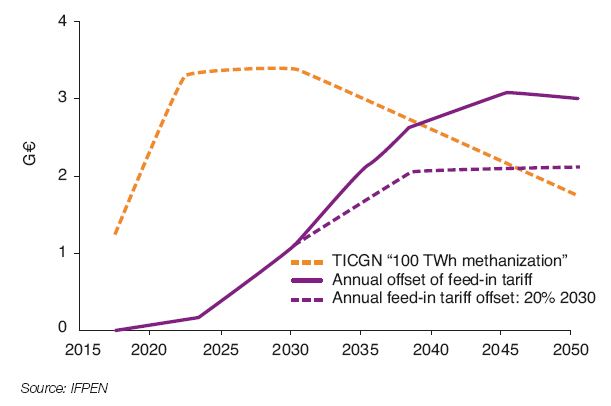
- 100 TWh produced by 2050 using methanization alone (referred as the “100 TWh methanization” scenario, Fig. 1);
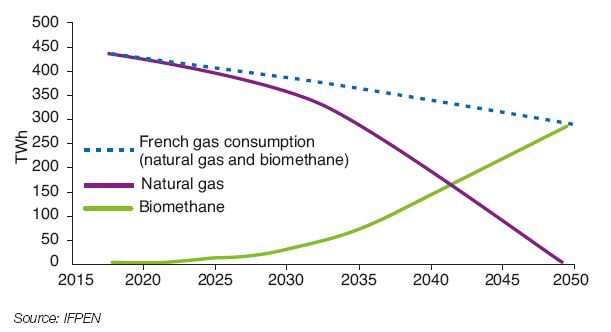
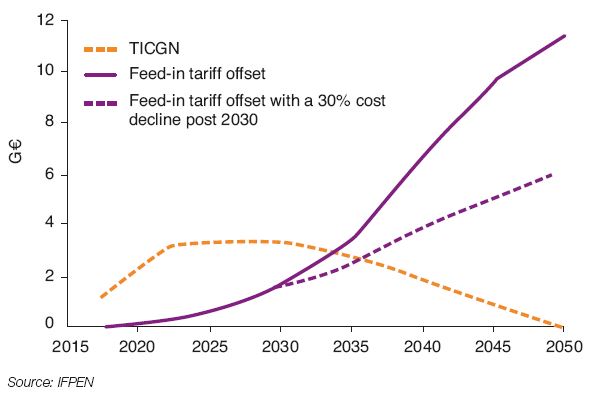
- full replacement by 2050 of natural gas demand with biomethane produced through methanization on one hand and two other processes on the other hand, especially after 2030 (referred as the “3 processes 100 % bio” scenario, Fig. 2).
Both scenarios assume a decline of the French gas consumption (excluding co-generation and power generation). All of these assumptions are consistent with those made in two recently published studies (Appendix 2).
methanization” scenario
Assumptions made (price and costs)
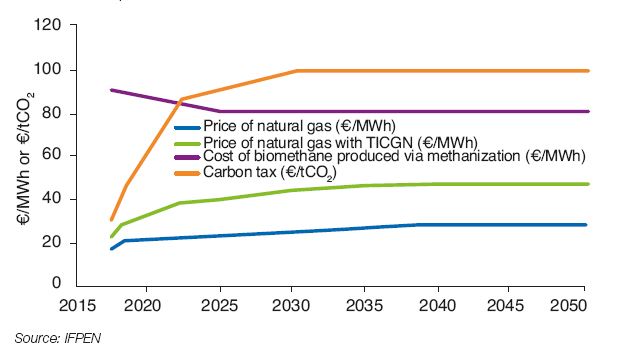
To determine the impact of the development of biomethane on the national gas bill (excluding transport/distribution costs) as well as the overall cost of the gas imports, it is necessary to estimate the future evolutions of the wholesale natural gas prices, the CO2 price and the biomethane production costs (Fig. 3 and 4).
For evaluating the wholesale gas prices trends in Europe, the reference source is the International Energy Agency (IEA), which publishes long-term projections in its annual report WEO1. The IEA thus expects a steady rise of the natural gas prices in Europe, increasing from $6/MBtu (€17/MWh) in 2017 to $9/MBtu (€27/MWh) in 2030 and $10/MBtu (€30/MWh) in 2040 (in constant 2016 $).
In regard to the carbon value incorporated into taxes on energy, the long-term target for France was enacted in the French Energy Transition for Green Growth act (LTECV), with a CO2 value set at €100/tCO2 in 20302. The French 2018 Budget Act, with a specific goal of combatting greenhouse gas emissions, set an accelerated CO2 value trajectory with €44.60/tCO2 in 2018 and reaching €86.20/tCO2 in 2022.
The resulting Domestic Consumption Tax on Natural Gas (TICGN) is calculated by taking into account the amount of CO2 emitted when using natural gas (approximately 0.19 tCO2/MWh). The TICGN is then applied to natural gas consumption. Due to a number of exemptions, this tax, being part of the government’s budget, only applies to a portion of the French consumption, estimated at approximately 50% of the total.
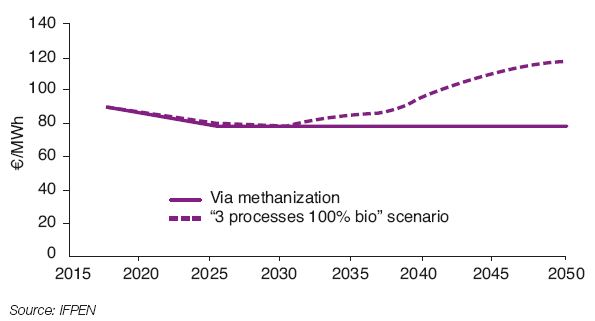
Regarding the cost of biomethane produced through methanization, a level of €90/MWh for 2017 was used as a reference for this analysis. A 12% reduction of this cost post 2025 was assumed, with reference to an ENEA3 report published recently. An alternative scenario that includes an additional 20% production cost decline is considered when calculating the financial support to the methanization industrial sector.
For the “3 processes 100% bio” scenario, the average cost rises after 2030, due to the gradual deployment of the other two industrial processes (pyrogasification and methanation). This cost will reach €120/MWh in 2050 (Fig. 4). An alternative scenario assuming a 30% production cost decline is also considered for calculating the public support needed for deploying those two processes.
via methanization and pyrogasification + methanation
Main results
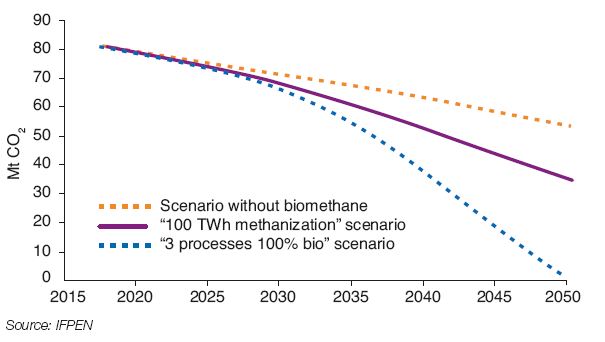
A sharp decline of CO2 emissions is observed when developing biomethane production (Fig. 5)
Due to the natural gas consumption decline, CO2 emissions will fall from 80 Mt in 2017 to 53 Mt in 2050 even without biomethane production.
When developing biomethane production, the CO2 emissions will decline even further reaching 35 Mt in the "100 TWh methanization” scenario in 2050, 34% lower than the scenario without biomethane. They will vanish almost entirely in the “3 processes 100% bio”4 scenario at the same time horizon.
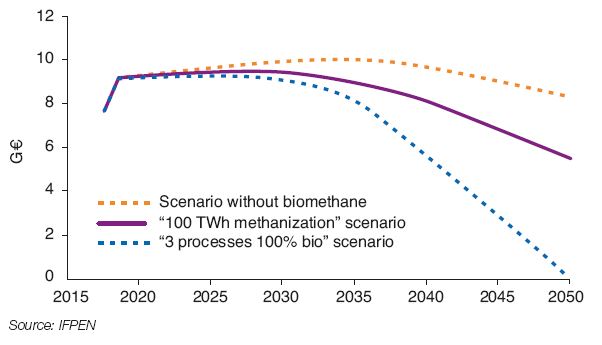
Biomethane reduces the cost of gas imports (Fig. 6)
The growing importance of domestically-produced biomethane reduces the overall cost of gas imports. From €8 billion in 2050 in a scenario without biomethane, it amounts to €5 billion in the “100 TWh methanization” scenario and reaches zero under the most ambitious biomethane scenario (“3 processes 100% bio” scenario), since natural gas is no longer in use within this timeframe.
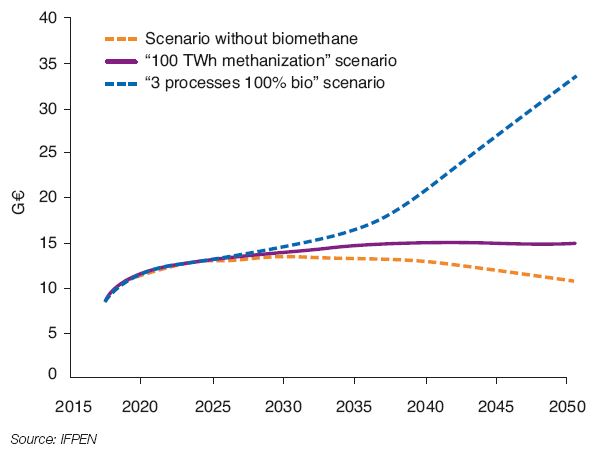
Somewhat significant increases in the national gas bill (Fig. 7 and 8)
Despite the decline in the overall consumption, spending on gas5 without biomethane is projected to rise noticeably, driven by increases in gas prices and the TICGN. It is expected to rise from €9 billion in 2017 to more than €13 billion by 2025. The decline in consumption will lead to a lower national gas bill after 2035, reaching €11 billion in 2050.
The development of biomethane produced by methanization will lead to a total bill of approximately €15 billion from 2035 and beyond. Compared with the situation without biomethane, this represents a €1.7 billion difference in 2035 and a €4 billion difference in 2050.
The bill of the “3 processes 100% bio” scenario will get close to €35 billion in 2050. Compared with the scenario without biomethane, the difference will be €3.5 billion in 2035 and €22 billion in 2050.
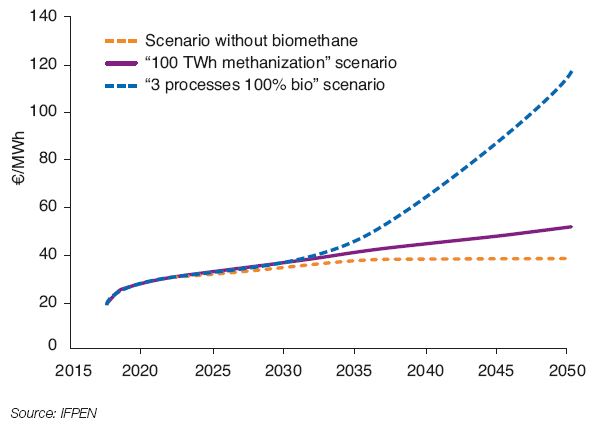
At the end of the period, the average gas price (including the TICGN impact ) will be €40, €50 and €120/MWh respectively in the three scenarios, compared with €23/MWh in 2017 (Fig. 8).
Estimate of financial offsets related to the set of feed-in tariffs (Fig. 9 and 10)
To support the biogas industry, a feed-in tariff is offered to biomethane producers by gas suppliers. The government then pays an offset to the gas suppliers.
This offset is calculated based on the difference between biomethane production costs and the gas price (mechanism is described in Appendix 3). It is currently set for a 15 year period.
Figures 9 and 10 allow to estimate the amount of the TICGN6 as well as the feed-in tariff offset calculated over a 15 year period in both scenarios. One variant is proposed with an additional 20% drop in the cost of methanization after 2030, and a 30% drop for the other two industrial processes.
For the “100 TWh methanization” scenario, the amount of the TICGN falls below the feed-in tariff offset from 2040 forward. This offset reaches €1.1 billion in 2030 and €3 billion in 2050. It falls to €2 billion in 2050 when assuming a 20% cost decline.
For the “3 processes 100% bio” scenario, the amount of TICGN falls below the feed-in tariff offset beyond 2034. This feed-in tariff offset reaches €1.6 billion in 2030 and €11 billion in 2050. It falls to €6 billion in 2050, if a 20% decline in costs is assumed.
These values should be compared to the actual total amount needed to support renewable energy processes. Mainly intended
for power industries, it totaled nearly €7 billion in 2017, an amount levied from part of the revenue generated by the taxation of petroleum products (€28 billion in 2016, Appendix 3).
It should be emphasized that these calculations do not take into account potential breakthroughs. A more pronounced and rapid decline in the cost of biomethane production, as has occurred with solar and wind power, would significantly reduce the amount of the offsets. This is obviously an important issue.
Which CO2 value to link with biomethane production ?
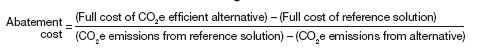
The notion of CO2 abatement cost allows to benchmark various industrial processes. It is defined as the difference of the cost to the CO2 emissions ratio of two technological solutions. This allows to compare, in increasing order of costs, a set of CO2 mitigating solutions.
This calculation, applied to the biomethane production processes compared to natural gas, estimates the CO2 abatement cost at around €300/tCO2 for methanization, €430/tCO2 for pyrogasification and €800/tCO2 for methanation. These values only make sense as part of a comprehensive analysis that incorporates various options for mitigating CO2 emissions. The relative complexity of this issue should be noted, which involves the need for a comprehensive overview beyond a single process (Appendix 4).
Discussion: positive impacts of biomethane production on CO2 and imports, for a limited cost prior to 2035
The described approach enables to evaluate the impact of biomethane development on certain parameters including CO2 emissions, gas imports, consumer gas bills and the amount of support required.
Within a broader overview, this approach should be supplemented by an analysis of the impact on other parameters such as investments, net jobs created, purchasing power and economic growth. It should also be noted that only two scenarios have been examined, which does not reflect all of the possible options.
This partial analysis shows that the soaring of biomethane production allows a reduction of CO2 emissions and a significant improvement in the degree of energy independence by reducing gas imports.
With regard to the national gas bill, based on the average gas price and included the TICGN, the difference compared with a scenario without biomethane is fairly modest before 2035. Beyond that date however the difference is likely to significantly increase if the goal of substituting natural gas with biomethane is pursued.
The amount of the feed-in tariff offset is steadily increasing reaching €2 to 3 billion in 2050 in the “100 TWh methanization” scenario and €6 to 11 billion in the “3 processes 100% bio” scenario. It is interesting to note that the amount of TICGN falls below the amount of the feed-in tariff offset in 2040 for the “100 TWh methanization” scenario and as soon as 2035 for the “3 processes 100% bio” scenario. Note that these results obviously depend on the assumptions made, which are highly uncertain, especially with regard to biomethane costs and the future price of natural gas.
From an economic point of view, independent of the trajectory of natural gas prices, at least two conditions are required for a significant expansion of biomethane production processes:
- a significant decline in biomethane production costs using new innovative processes;
- the control of gas consumption.
Meeting these conditions should reduce the potential difference between biomethane costs and the price of imported natural gas, while limiting the rise of the national gas bill to prevent constraints on buying power
François Kalaydjian - francois.kalaydjian@ifpen.fr
Guy Maisonnier - guy.maisonnier@ifpen.fr
Draft submitted in July 2018
APPENDIX 1
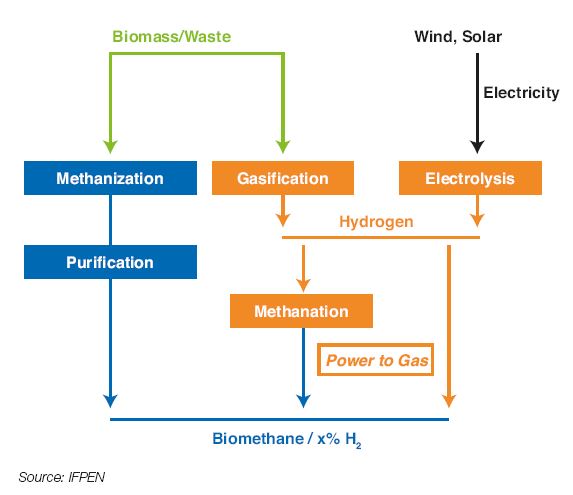
Biomethane and Power to Gas (Fig. 11)
Biomethane production can be achieved by methanization of biomass or waste, and through methanation of hydrogen in the presence of CO2. Hydrogen can be produced through biomass gasification, water electrolysis (using a low-carbon power generation), or through the reforming of biogas or natural gas including CO2 capture.
Power to Gas refers to biomethane production using the methanation process. It also includes the option of direct injection of hydrogen into the natural gas grid though in limited quantities (approximately 10%).
These options are considered within the scope of a broader deployment of hydrogen in response to the industrial demand, storage needs and in the transport sector.
APPENDIX 2
Two recent studies propose scenarios for the development of biomethane in France
2050 projections developed in this study, in terms of gas demand for gas and domestic biomethane supply, are based on two recently completed studies.
The first, which dates from 2017, was jointly conducted by gas transport and distribution network operators. In this provisional summary7, a share falling between 6% and 34% of renewable gas injected into the grids is expected by 2035. This represents volumes between 20 and 140 TWh.
The second study, performed by ADEME8, analyzes whether a mix of 75 to 100% of renewable gas in France by 2050 can be achieved. Global resources are estimated at 460 TWh, distributed roughly equally among the three processes: methanization (140 TWh possible), pyro-gasification (180 TWh) and Power to Gas (140 TWh).
This potential production would be sufficient to meet demand estimated at 280 to 360 TWh in 2050.
APPENDIX 3
Biomethane funding methods
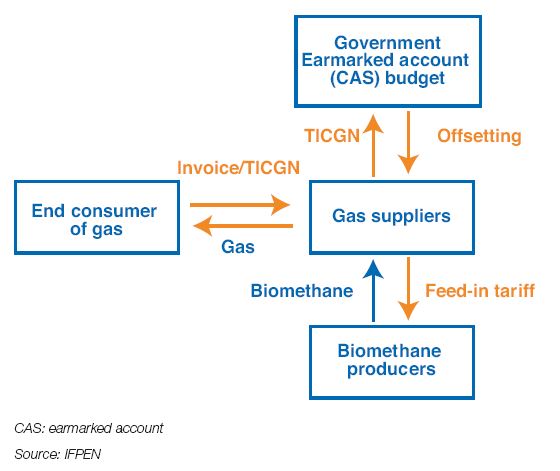
Biomethane production is supported by the French government through a purchasing obligation: every biomethane producer that injects gas into the grid is compensated through a feed-in tariff, which is paid by the gas supplier with which it signed a contract to purchase its production.
The extra cost borne by natural gas suppliers when purchasing injected biomethane is offset through a payment made by the government, calculated with reference to the average price on the natural gas9 wholesale market (Fig. 12).
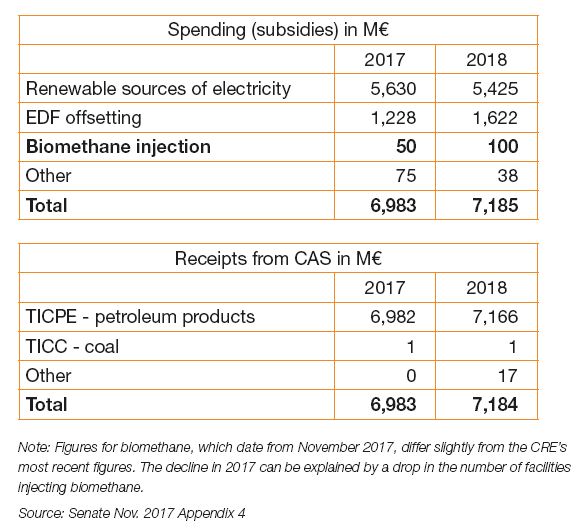
The cost of subsidizing biomethane injection doubled between 2016 and 2017, rising from €18.6 million to €37.3 million. The CRE (Commission de régulation de l’énergie) estimates that it will reach €99.5 million in 201810. Revenues derived from the TICGN reached €679 million in 2015 and €1,104 in 2016, which covers expenses related to biomethane injection.
It should be noted that in the government’s budget, the TICGN is allocated to the “public energy services” program, like the CSPE (contribution to public energy services), tax on electricity. Offsetting financial support for renewable energies is mainly done using a percentage of revenues generated by the TICPE, French energy consumption tax energy (mainly oil products), in an earmarked “energy transition”11 account, created in 2015 (Table 1).
APPENDIX 4
Discussion on the value of CO2
The work proposed here does not examine the question of the trajectory of the value of carbon associated with biomethane. This subject requires a more extensive analysis, and the issue has been raised in the following studies:
An analysis by the French Ministry for an Ecological and Inclusive Transition addresses the issue of “carbon price”, “an important aspect of the fight against climate change”.
Since 2007, McKinsey has proposed a calculation of abatement costs on a global level. Abatement cost, which allows a comparison among various processes, is defined as the ratio of the differences of cost and CO2 emissions of two technological solutions:
A study dating from 2010 raises the issue of defining the value of carbon. Five interpretations were suggested:
- the expected reduction of climate change induced damage, though difficult to assess,
- the CO2 emissions reduction cost referred to as an average or marginal abatement cost,
- the optimum social value, equalizing cost and marginal profit,
- the politically negotiated value referred to as the reference carbon value,
- the EU ETS12 market price (European carbon market, etc.).
The Académie des technologies raised this same issue in its 2017 report: what is the reference price of CO2? It mentioned three:
- the socio-economic price of carbon reflecting the cost of present and future consequences of emitting an extra ton of CO2,
- the cost of abatement or avoidance is the price to be paid to reduce a given quantity of CO2 emissions,
- the actual price (sometimes called the notional price), calculated from each regulation or grant mechanism and the carbon savings achieved.
In 2016 the French Treasury department published a comparison between renewable processes of the cost per ton of CO2 avoided (variation from €59 to more than €500 for electricity production). In another document, “Trajectories of low carbon transition in France at low cost” were studied.
Finally, it is important to note the ongoing work in France regarding the reference price of carbon following those dating from 2008. The new trajectory of the reference carbon value must be “consistent with climate targets in France”. Recommendations are expected on the use of this value “in assessing public policies and in the selection of private investments and financing”.
(1) WEO 2017 – IEA 2017
(2) Taxation of energy - MTES
(3) A total of 30% is mentioned, which takes into account the impact of a 100 €/tCO2 carbon tax
(4) These estimates assume that there are no methane leaks during methanization
(5) With regard to the price paid by consumers, the bill (excluding VAT) is based on the wholesale price of natural gas, the cost of biomethane and the TICGN applicable to approximately 50% of gas consumption. Network costs are not included in this calculation
(6) For information only, to the extent that it is not currently allocated to biomethane financing
(7) Multiyear provisional summary of gas 2017 – GRDF 2017
(8) Mix of 100% renewable gas in 2050 ? - ADEME 2018
(9) Draft 2018 Budget Act – Energy transition mission - Budget (10) Assessment of expenses for public energy services in 2018 - CRE
(10) Assessment of expenses for public energy services in 2018 - CRE
(11) Taxation of energy - MTES
(12) European Union Emission Trading Scheme