

01.01.2018
30 minutes of reading


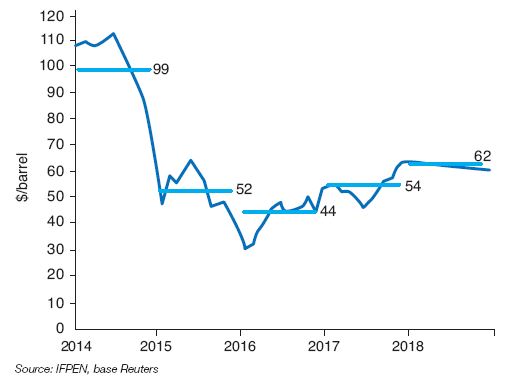
In 2017, the price of Brent stood at an annual average of $54/barrel, up 24% (+$10/barrel) compared to 2016. Influenced by a stabilizing oil market, OPEC output regulation policy and geopolitical tensions, it surpassed $60/barrel at the end of 2017. The markets anticipate a price of $55 to $70/barrel in 2018. These thresholds change based on the outlook for demand and the geopolitical climate. Uncertainty surrounding U.S. production levels is another significant factor for price volatility.
Ongoing stabilization of the oil market
Rising oil prices during 2017, which resulted in a $10/barrel increase over one year, reflected the market’s trend toward a new supply/demand equilibrium. Excess supply has gradually decreased, due at first to declining U.S. supply starting in mid-2015, and later to OPEC’s action to limit supply beginning in January 2017 (Fig. 1).
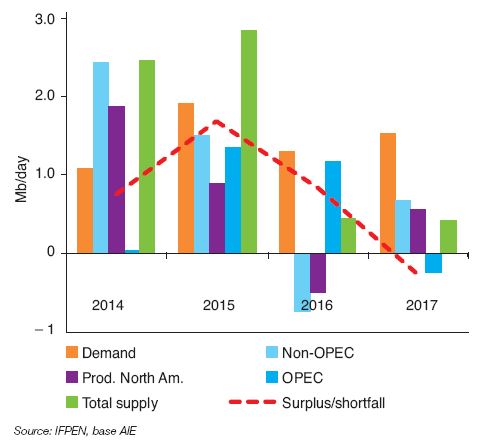
At first, U.S. production shifted relatively quickly, with slower growth in 2015 followed by a decline in 2016. But U.S. producers gradually adapted by slashing production costs, allowing recovery of their investments from mid-2016. Thus, these operators were not permanently weakened, as OPEC likely hoped, but first survived then subsequently adapted.
This caused OPEC to change its strategy in order to increase the pace of market stabilization. This was the goal of the OPEC/non-OPEC agreement signed in November 2016, which was twice extended in May and November 2017 and now covers all of 2018. It reduced output by 1.8 Mb/day, including 1.2 Mb/day for OPEC and 0.6 Mb/day for non-OPEC countries, including Russia and Mexico.
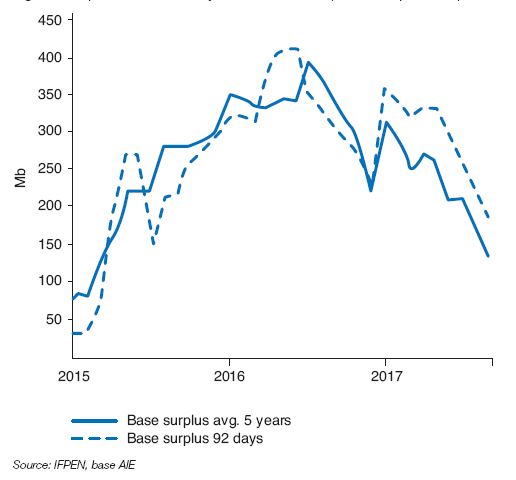
Rising demand and OPEC’s output regulation led to a sharp drop in surplus stocks held by OECD countries. They were halved overall between the second quarter of 2016 and the third quarter of 2017 (Fig. 2). From this perspective, OPEC’s strategy has been rather successful.
Steady rise in oil prices after June 2017
Surplus reduction led to a steady increase in oil prices, rising from $46/barrel in June to more than $60/barrel at the end of 2017 (Fig. 3). Key factors underlying these rising prices include:
- strong annual growth in demand of 1.5 Mb/day in 2017, with 1.3 Mb/day expected in 2018 according to IEA;
- compliance with the OPEC/non-OPEC agreements, imposed due to market weakness, has been a true success for the cartel;
- the cap on supply during the second half of the year by two countries exempt from the OPEC agreement, Libya and Nigeria;
- indicators that − wrongly − suggested a possible slowdown in U.S. oil production;
- growing concerns about the impact of declining investment in the oil industry since 2015;
- a tense geopolitical climate in the Middle East (see appendix).
These six issues will no doubt continue into 2018, and will impact the price of oil. In early January, the futures markets expected prices to rise during 2018 to more than $65/barrel, $11/barrel above the average price during 2017 ($54/barrel).
This increase is due to the geopolitical context but also to the expected depletion of surpluses. In this context, the marginal production cost of the last unit needed to balance the market becomes the benchmark price. But this is clearly not the only possible development. A wide range of scenarios remain conceivable, due to uncertainties that impact the six parameters discussed above.
Substantial uncertainty, again related to growth in U.S. production
During 2014, U.S. production of liquid fuels rose by 1.8 Mb/day, then by 1 Mb/day the following year, triggering a collapse in oil prices due to excess supply. This drop triggered a decline in U.S. activity and production during 2016 (–7 Mb/day) (Fig. 4).
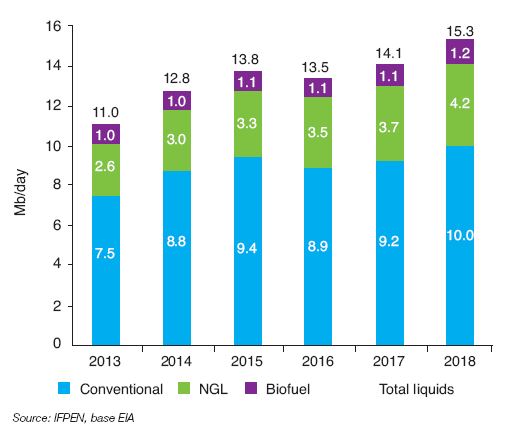
However, due to reductions in production costs, and contrary to OPEC’s expectations, U.S. production again rose in 2017 (+0.6 Mb/day, oil and NGL). For 2018, the U.S Energy Information Administration (EIA) has consistently revised its growth expectations upward compared with 2017: +0.6 Mb/day in January, +1 Mb/day in July, +1.2 Mb/day for its most recent projections in November. These revisions reflect the substantial uncertainty regarding production of these “new” oils that are highly responsive to the market environment. The North Dakota Director of Natural Resources indicated that shale oil production in the Bakken basin could reach 1.6 to 2 Mb/day at an oil price of $60/barrel, compared with stagnation around 1 Mb/day at $50/barrel.
Overall, productivity per well, the number of wells drilled, the unit cost of production per basin, and of course the price of oil are the main factors that would significantly change the growth of U.S. production. As in the past, our models confirm varying potential for growth depending on drilling activity (see appendix). The current upward projection for 2018, being applied by OPEC and IEA, could be cast in doubt depending on shifts in these various parameters. OPEC must adapt to this situation in order to define its strategy. This was decided in the agreement signed last November, which calls for a June 2018 update to assess the market.
OPEC and non-OPEC countries extended their agreement into 2018
Tensions among OPEC member states were set aside, considering the financial challenges related to the organization’s output regulation. Numerous signals had been given to the markets, especially by Saudi Arabia and Russia, to herald the extension of the OPEC/non-OPEC agreement.
This firm stance is based in part on OPEC’s most recent long-term report (World Oil Outlook 2017). Unlike in 2014, OPEC no longer questions the growth of shale oil production. It now estimates an increase of nearly 3 Mb/day by 2022, rising from 4.7 Mb/day in 2017 to 7.4 Mb/day. The actual pace of growth could in fact be higher, which would pose a real challenge to OPEC.
This threat, which is now considered structural, explains the unified oil policy of OPEC countries and certain non-OPEC countries, such as Russia and Mexico. Saudi Arabia even tried to convince Brazil to join in this approach, though so far without success. It is true that Brazil is likely to weigh heavily on global oil supply. The country’s national agency expects production to reach 5 Mb/day by 2027 compared with 2.6 Mb/day in 2017.
From a financial perspective, the challenges were considerable, with oil prices likely to fall to $50/barrel or lower without an agreement, or to stabilize at $60/barrel or higher with an agreement and in the case of moderate growth in U.S. supply.
This $10/barrel difference represents a 17% decline in exports, i.e. around $110 billion per year for OPEC, an amount equal to 3% of the cartel’s GDP. This appears to be sufficient to continue petroleum cooperation beyond geopolitical disputes.
Investments in the upstream oil sector
Numerous voices have highlighted the risk of a longterm supply shortage tied to declining investment in the exploration-production sector. This decline has been extraordinary, reaching approximately 25% in 2015 and 2016, falling to just half of 2014 levels.
The challenge is to determine whether this decline in investment is compatible with the future development needed to cover both the annual natural decline in production (2.5 to 4 Mb/day) according to sources1) and growing demand (around 1.5 Mb/day).
First, this presumes that the decline in costs seen since 2014 is sustainable. Various indexes reveal that inflation appeared in the upstream oil sector starting in late 2016, but at relatively low levels of 2 to 4%, excluding fracking in the United States (16%). But this does not affect the estimated average 36% decline in upstream oil compared with the maximum reached in 2014 (Fig. 5).
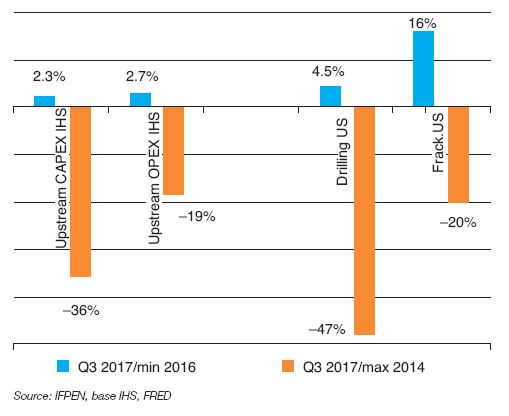
To estimate investments, activity levels should also be estimated. Measured by the number of drilling operations, it has declined by 44% worldwide since 2014, 54% in the United States. Given the rise in productivity, particularly in the United States, a long-term 30% decline in activity could occur.
Presuming a 30% decline in costs and activity, this would imply a 50% cut in investments. OPEC reached similar conclusions in its most recent long-term report (World Oil Outlook 2017). The outlook for average investment from 2017 to 2022 is only 10% above 2017 expectations.
Data published by IEA in its long-term report suggest a somewhat greater estimated difference. To balance the oil market, around 20% more on average would be needed until 2025 under the trend-based scenario. On the other hand, under a scenario with greater control of consumption, investment stability would be enough to balance the market.
This assessment highlights a 10 to 20% investment shortfall in the upstream sector, according to analyses in terms of estimated needs through 2025. This effort, which remains fairly modest, will be needed to avoid a supply-side shock in the relatively short term. These objectives, though below 2014 records, are not unattainable. Initial estimates suggest increases of 4% in 2017 and 2 to 6% in 2018.
It should be emphasized that, within the scope of the energy transition, some investors have become more selective when choosing projects, or have even stopped financing the industry. This was the case for the World Bank, which announced its decision at the One Planet Summit in December 2017.
While the bank’s commitments in the industry are modest, this could signal growing difficulty in financing future exploration and production activities. However, it should be noted that oil covers 30% of world energy demand. Its share reaches 40% in Europe. This means that it will take a long time to reach a post-oil age, especially in the transport and petrochemical sectors. But this opens the door to creativity and innovation, finding sustainable solutions to gradually reduce our dependence on oil.
2018 forecasts: $55 to 65/barrel excluding extreme circumstances?
Early indications for 2018 suggest a balanced market, characterized by declining surplus inventories and a relatively small difference between supply and demand. If this is the case, the highest marginal cost will define trends in oil prices in the absence of a specific crisis, be it financial, economic or geopolitical.
In a recent presentation to investors, a U.S. company put this cost between $65 and $75/barrel, which corresponds to development of U.S. conventional oil, oil sands and unconventional Russian oils. But these resources will not be a priori needed to balance the oil market in 2018.
This puts the top price at $65/barrel, which corresponds to the most costly deep offshore developments (Gulf of Mexico, Angola and Brazil). This also takes into account the notion that resources aside from just shale oil, which has the lowest production costs, will be required in the future.
At the end of 2017, the market has indeed exceeded $60/barrel. Can this trend be sustained? The growth of American potential, OPEC’s unity and the amount of demand for oil are factors that could change the game. A sharp rebound in U.S. supply could return prices to $50/barrel. Conversely, a tight supply could push prices to $70/barrel. Oil market analysts generally foresee a range of $55 to $70/barrel for 2018.
Guy Maisonnier – guy.maisonnier@ifpen.fr
Final draft submitted in January 2018
APPENDIX
Geopolitical tensions in the Middle East during 2017
- June 5: a diplomatic crisis begins between Qatar and four Arab countries, Saudi Arabia, Egypt, Bahrain, and the United Arab Emirates.
- September 25: referendum on Kurdish independence followed by Iraq’s intervention to retake the Kirkuk region.
- November 4: in Saudi Arabia, princes, ministers and businessmen are arrested in a crackdown, following the creation of a new anticorruption commission led by Crown Prince Mohammed ben Salman. On November 9, Saudi authorities announced the arrest of more than 200 people, citing misappropriation amounting to $100 billion.
- November 4: the Lebanese prime minister, Saad Hariri, announced his resignation while in Saudi Arabia. Iran pointed out the risk of destabilization in Lebanon.
- November 6: Saudi authorities accused Iran of involvement in a missile strike by Yemini rebels that was intercepted above Riyadh International Airport, calling it an act of war. Iran rejected these accusations in a letter sent to the United Nations.
- December 28: beginning of demonstrations in many cities in Iran.
Oil challenges in Kurdistan
Production in the autonomous Kurdistan region is estimated at 0.6 Mb/day, half of which originates from deposits in Kirkuk, Bai Hassan and Avana Dome. This region is again under Iraqi control, which intends to boost production with the support of the Kurdish company Kar. Expansion projects (stated objective 0.7 Mb/day) have also been proposed to BP, a long-standing player in the region.
A pipeline built in 2014, with a 0.7 Mb/day capacity, passes through Kurdish territory and leads to Turkey, permitting oil to be exported from the autonomous region. It is managed by North Oil Company, a Kurdish company.
The Iraqi company Somo is in negotiations to export oil from Kirkuk. Somo, which planned to reopen a pipeline (0.6 Mb/day) that had been shut down since 2014, appears to favor construction of a new pipeline that bypasses Kurdistan.
In October 2017, the impact on the oil market was estimated at 0.2 Mb/day, tied to declining exports. For Iraq, they reached 3.7 Mb/day, of which 3.3 Mb/day was exported through the Basra terminal in the south, and 0.4 Mb/day through Turkey. For Kurdistan alone, exports are estimated at 0.27 Mb/day, slightly less than half of what was sold before September. These falling sales and unstable environment increased the pressure on the oil market at the end of 2017.
Modelling U.S. shale oil production
Each month, the EIA (Energy Information Administration) publishes statistical data on seven shale oil basins: Permian (2.5 Mb/day in October 2017), Eagle Ford (1.2 Mb/day), Bakken (1.1 Mb/day), Anadarko (0.5 Mb/day), Niobrara (0.5 Mb/day), Appalachian (0.1 Mb/day) and Haynesville (0.04 Mb/day).
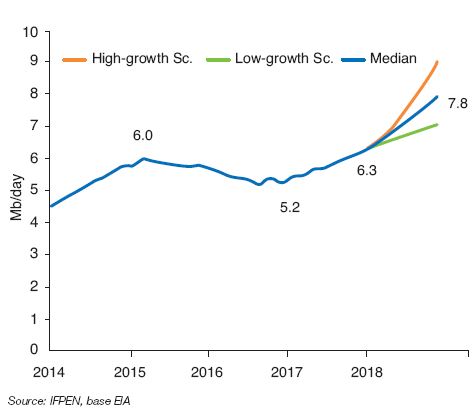
Available data concerns the number of rigs, productivity per rig, natural production declines and production levels. Based on this data, IFPEN has developed a model to simulate possible developments (Fig. 6).
The simulation is based on an analysis of three parameters:
- productivity levels by basin, which are currently stagnant or declining, but 2 to 3 times higher than in 2014. This explains why it is possible to increase production with fewer rigs;
- natural production declines, which moves at an average of –6% per month;
- drilling activity measured by the number of active rigs. The outlook is based on three scenarios. The low-growth scenario is based on stagnant activity. This corresponds to the trend at the end of 2017, with around 750 active rigs since June (compared with 1,400 to 1,500 between 2011 and 2014, and 330 in May 2016). The unlikely high-growth scenario counts on a return over two years at 2014 record levels.
The analysis presumes that oil services and oil transport capacity adapts to the increased supply, as is the case in the Permian basin in particular. It also presumes oil prices that adjust along with the foreseeable rise in production costs2. These costs are currently estimated at around $40/barrel for oil prices of around $60/barrel at the end of 2017.
On such grounds, these simulations predict an average increase of 0.9 to 1.8 Mb/day in shale oil production during 2018. The low-growth scenario of 0.9 Mb/day is close to current expectations based on stable activity.
Lower-for-longer oil prices?
In the past, the oil markets experienced several significant price drops on the order of 50 to 60%, as took place starting in July 2014.
In many cases, it took three to four years to return to initial price levels. For example, this occurred during the period from 2008 to 2011, when oil prices fell as a result of the economic crisis.
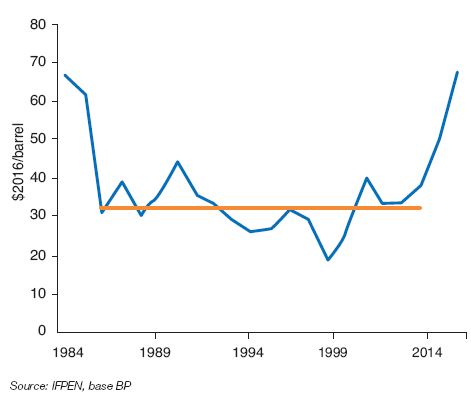
On the other hand, the episode that began in 2014 was similar in form and substance to the events of 1986. In both cases, there was a structural market change characterized by a sharp rise in new production, reinforced by falling demand during the 1980s. In both cases, prices fell by half within one year. In 1986, prices fell to $32/barrel (in constant 2016 $), a level which would remain the average price for the next 17 years until 2003 (Fig. 7).
The lower-for-longer oil prices scenario, with occasional upheavals, has been the reality in the past over a long period of time. Thus, it cannot be ruled out, even though the forecasters’ “consensus” counts on declining shale oil production after 2020.
Impact of electric vehicles on worldwide oil consumption
The growing importance of electric vehicles, whether or not rechargeable, will gradually reduce the market share of internal combustion vehicles. This will also impact worldwide oil consumption.
The outlook for development is currently uncertain, since it depends on progress achieved in terms of cost and autonomy for these vehicles.
Accordingly, there is a broad range of scenarios concerning electric vehicle development. Some scenarios estimate electric vehicle inventory at 200 to 300 million by 2040, an increase by a factor of 100 to 150 compared with 2 million vehicles in 2016. The higher range was used by IEA in its central scenario in the most recent 2017 WEO report. This represents around 10% of total expected fleet within this timeframe.
IEA estimates that nearly 900 million electric vehicles would be needed by 2040, — 45% of the fleet — to maintain a Sustainable Development (SD) scenario consistent with the goals of the Paris accords (limit temperature increase to 2 °C). Bloomberg foresees an intermediate scenario with more than 500 million vehicles by 2040, 25% of the total fleet (Fig. 8).
The rise of electric vehicles will reduce oil consumption by 3 to 5 Mb/day for a fleet of 300 to 600 million vehicles in 2040 (Fig. 9). The impact would rise to 8 to 9 Mb/day under IEA’s Sustainable Development (SD) scenario (870 million vehicles).
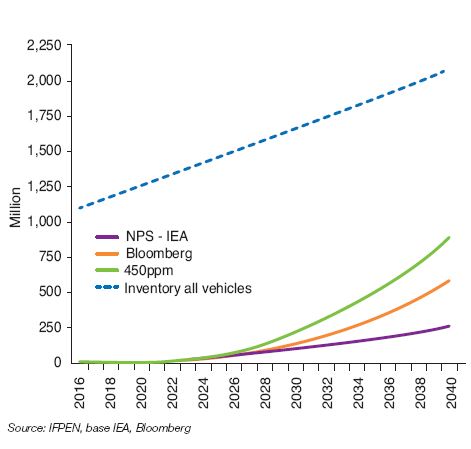
vehicles per scenario – 2016 / 2040
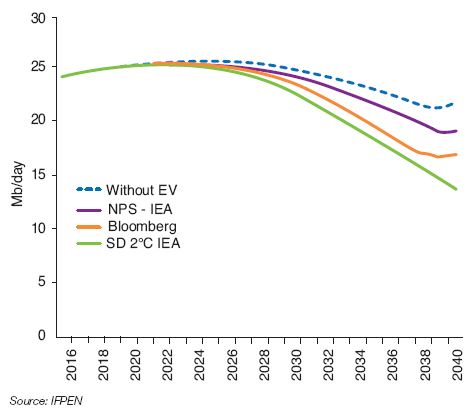
based on the scenarios – 2016 / 2040
The oil market faces significant challenges, since these declines represent 15 to 35% of private vehicle consumption. However, it should be noted that the impact before 2030 will be relatively modest. Futhermore, oil consumption by private vehicles covers only 50% of demand by the transport sector, and around 25% of total demand for oil. The impact on this total, which should fluctuate in the vicinity of 100 Mb/day, is around 3 to 9%.
This is far from negligible and will complement all the measures needed to reduce oil consumption by private vehicles, including:
- mobility management,
- more rapid vehicle fleet renewal,
- higher-efficiency combustion engines,
- growing importance of alternative energy solutions, such as electric vehicles, natural gas and bioNGV engines.
Other measures will also be needed in the transport, freight, maritime and aviation sectors. Optimized management, natural gas and biofuels are among the possibilities to explore.
(1) A net balance should take into account expected increases related to past projects
(2) When oil prices are high, forward sales strategies enable cyclical price declines to be managed