

02.04.2019
30 minutes of reading


Exploration-production investments
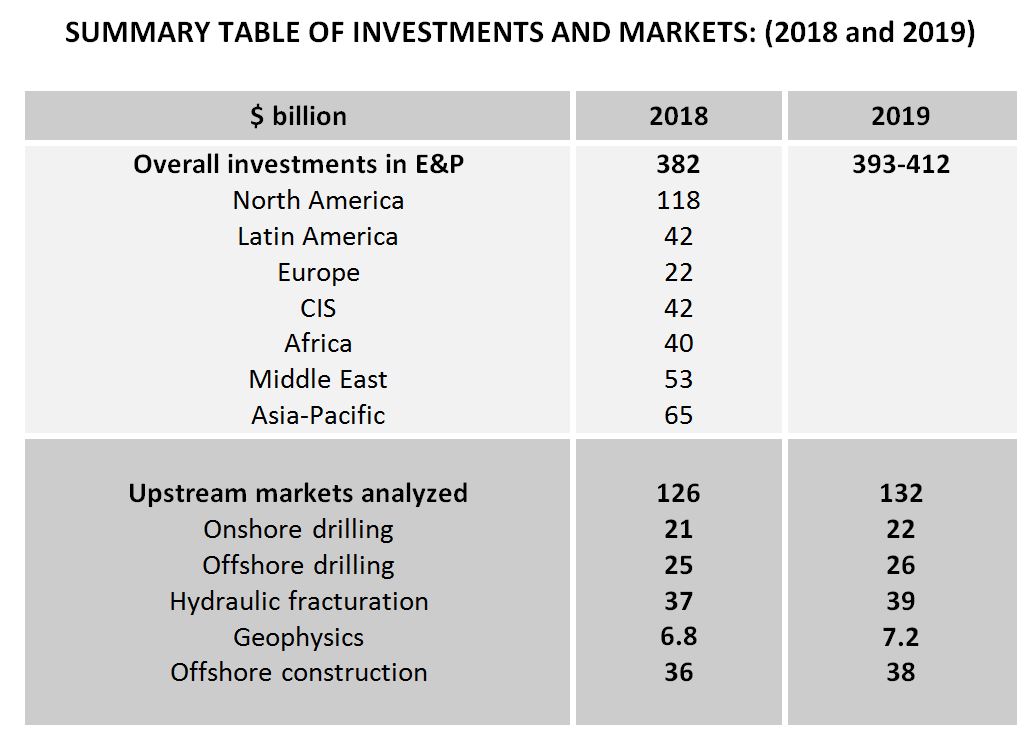
The recovery in exploration and production (E&P) investment, which began in 2017 after two years of sharp decline, continued in 2018. Worldwide, upstream oil and gas investments are estimated at approximately $382 billion, up $24 billion (+7%) from 2017. However, this level remains 40% below the maximum reached in 2014 ($655 billion) and the 2018 annual growth rate remains well below those observed over the period 2002 to 2014. During this period, investments had increased by an average of 15% per year. As in 2018, there is a significant disparity between North America, which is growing at double-digit rates (+18%) and the rest of the world, which is much less dynamic (+2.4%). National airlines (NOCs) accounted for 45% of global investment in 2018, compared to 20% for majors1 and 45% for independent companies. In 2019, growth is expected to continue at a rate of between 3% and 8%.
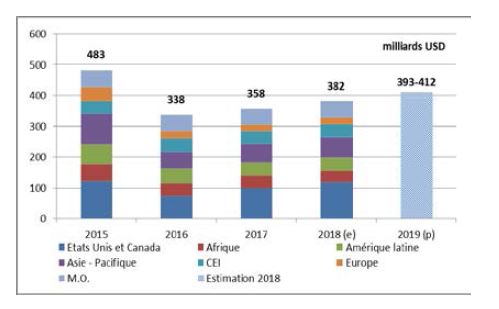
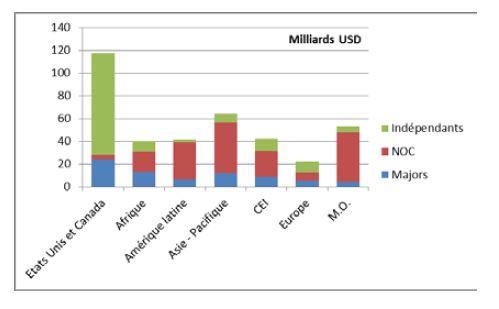
At the regional level, North America2, which receives 30% of global investment, is once again in the lead, both in terms of growth rates (+18%) and absolute growth (+$18 billion or 74% of global growth). Nevertheless, growth decelerated which had jumped 35% in 2017 by 35% in 2017, driven by independent companies, whose investments increased by 44%, while those of the majors declined slightly. In 2018, the situation was more balanced, with a recovery in investment by the majors in North America (+24%) and more moderate growth for the independent oil companies (+16%). This trend is expected to continue as the majors continue to focus on shorter-cycle investments, such as shales in the US. In 2018, BP acquired the shale oil and gas assets of BHP Billiton and Exxon Mobil, Chevron and Royal Dutch Shell also entered the US shale market more aggressively. As in 2017, investment growth in North America is driven by shale oil exploitation, particularly in the Permian and other oil basins. According to Barclays3, investments in the Permian would thus have increased by 27% in 2018 compared to 12% for the other predominantly oil-rich basins. On the other hand, investments in predominantly gas-intensive basins were down by 10%. In the Gulf of Mexico, offshore CAPEX were down 1% after a 22% drop in 2017.
The Asia-Pacific region ranks second in E&P CAPEX growth with a 7% gain over 2017. However, there is a wide disparity between Oceania, where investments are down by 28% due to the completion of many LNG projects, and Asia, where they are up by more than 22%. Growth in the region is mainly driven by national companies and in particular the three Chinese national companies Petrochina, Sinopec and CNOOC. These three companies collectively increased their capital expenditures by $7.2 billion (25%). Their weight in regional investments has become considerable, with their E&P investments accounting for half of the total CAPEX in Asia-Oceania in 2018. Companies heavily involved in Australian LNG projects have significantly reduced their investments: Inpex (-$2.5 billion), Chevron (-$1.7 billion), Shell (-$0.8 billion), Total (-$0.8 billion).
Investments are also picking up in Europe (+5%) after four years of decline, driven by the recovery in Norway and the United Kingdom. The effort made by operators to reduce development costs and the rise in oil prices have helped to increase the profitability of new projects such as Johan Sverdup and Castberg in Norway. In the United Kingdom, investment also picked up again after reaching a low point in 2017. After a period 2016-2017 marked by an exceptionally low number of investment decisions in new fields, approvals of new projects have accelerated and operators are more optimistic. Nevertheless, the recovery could be short-lived, with investment in the United Kingdom expected to decline as early as 2019 and for subsequent years according to projections by the OGA (Oil and Gas Authority, the British regulator). In Norway, according to the Norwegian Petroleum Directorate (NPD), investment is expected to continue to increase in 2019 before declining from 2020 onwards.
Investments increased by 2% in Latin America thanks to majors (+44%) and independents (+39%), while NOC budgets fell significantly by 4%. Exxon Mobil's investments in the region jumped 187% (+$1.1 billion), mainly due to its activity in Guyana, while Total's investments jumped 117% (+$0.6 billion). Among the NOCs, Ecopetrol stands out with a 58% increase in investments (+$1 billion). Pemex increased its own by 9% (+$0.7 billion). In contrast, PDVSA's investments fell by 42% (-$2.9 billion). Although Petrobras' investments declined by 9% (-$1.1 billion), it is still the largest regional investor (with 26% of investments in Latin America), followed by Pemex (22%) and PDVSA (10%).
In the Middle East, capital expenditure increased slightly by 1.6% in 2018. In Saudi Arabia, Saudi Aramco's CAPEX increased by 2%; in the United Arab Emirates, that of ADNOC increased by 8%; in Kuwait, KOC's expenses increased by the same proportion (+8%). These three companies alone accounted for 60% of E&P investments in the Middle East in 2018. In Oman, PDO investments fell significantly (-15%). Regional investment growth is also moderated by lower budgets for Shell (-49%), Inpex (-43%) and BP. The situation is expected to change dramatically in 2019 with significant investments expected in the Middle East, especially in gas in Qatar and the UAE.
Investments in the CIS remain stable. While Gazprom and Exxon Mobil's expenses grew strongly by 60% (+$1.3 billion) and 30% (+$1 billion) respectively, Rosneft's investments grew more modestly by 5% (+$0.6 billion). On the other hand, the CAPEX of Lukoil, Petrochina and BP are falling sharply: -24% for Lukoil (-$1.7 billion), -64% for Petrochina (-$1.5 billion) and -41% for BP (-$0.5 billion). Rosneft, Gazprom (including its subsidiary Gazprom Neft) and Lukoil, accounted for 62% of total E&P investments in the CIS region in 2018.
In Africa, CAPEX were down 3%, mainly due to Total, BP and CNOOC, whose investments fell by 28%, 22% and 51% respectively. In contrast, Exxon Mobil's and Shell's budgets are increasing by 20% and 54% respectively. In Nigeria, the NNPC CAPEX remains stable, with legislative and political uncertainties weighing on investments. In Egypt, offshore exploration activity is recovering after years of decline. In Angola, Sonangol's investments decreased by 8% and in Algeria, Sonatrach's budget remained stable. In Libya, onshore drilling activities have resumed after three years of interruption. The exploration and development of oil and gas projects in Africa is expensive and more complicated from a regulatory point of view than in other regions of the world. Although investments are picking up again in 2019, it will nevertheless remain well below what we have seen before.
The recovery in global E&P investment continued in 2018 on a similar basis to that observed in 2017, with large regional disparities, particularly between North America and other regions. However, unlike 2017, when investment in many regions (Latin America, CIS, Europe and the Middle East) had continued to decline, 2018 saw CAPEX growth spread to all regions except Africa. The recovery is expected to continue in 2019 despite uncertainty about oil prices.
Onshore and Offshore Drilling around the world
In 2018, 67,000 wells were drilled onshore and 2,300 offshore. Global drilling activity continued to grow (+7%) following the 2017 rebound (+25%). This recovery was mainly due to the increase in the number of onshore drilling (+8%), as offshore drilling activity continued to decline (-4%).
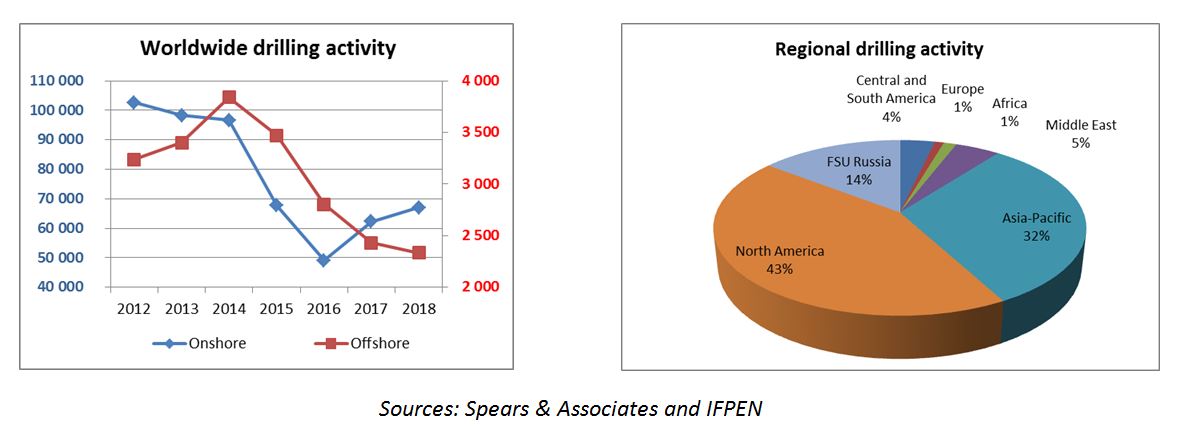
In North America, onshore drilling is still very active with the development of unconventional hydrocarbons in the United States. In 2018, there were 15,000 horizontal wells drilled for gas and shale oil, representing more than 20% of global drilling activity. However, in the United States, the number of wells drilled but not completed increases by 250 wells/month to 8,500 DUC4. These wells, which were drilled less than two years ago and are not yet in production, are mainly located in the Permian Basin and represent significant production potential that can be quickly implemented.
Deep offshore drilling is still penalized by high drilling costs, which limits investment in new projects. However, rig utilization rates appear to have reached a low point, and day rates, particularly for jackups and shallow water developments in the Gulf of Mexico, have picked up again.
In 2018, global onshore drilling revenue is expected to exceed $20 billion, up 15%. Offshore drilling is expected to continue to decline (-10%) and represent $24 billion, slightly higher than onshore drilling revenue. The hydraulic fracturing market continues to expand (+35%) and is expected to approach $37 billion, its highest levels since 2014.
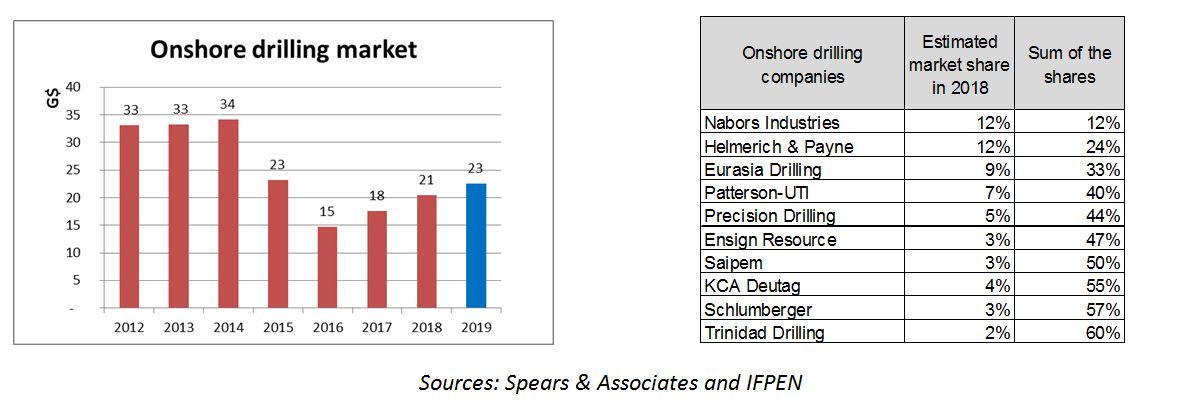
The world's ten largest onshore drilling companies account for 60% of the market. Despite the recovery in growth, the onshore drilling market is still far from returning to the 2014 revenue level, barely half of its decline has been recovered. The fall in the price of crude oil at the end of 2018 prompted some investors in shale to revise their development plans downwards. After 15% growth in 2018, the onshore drilling market in 2019 is expected to remain highly dependent on the development of unconventional crude oil and to grow at a slower pace (+10%).
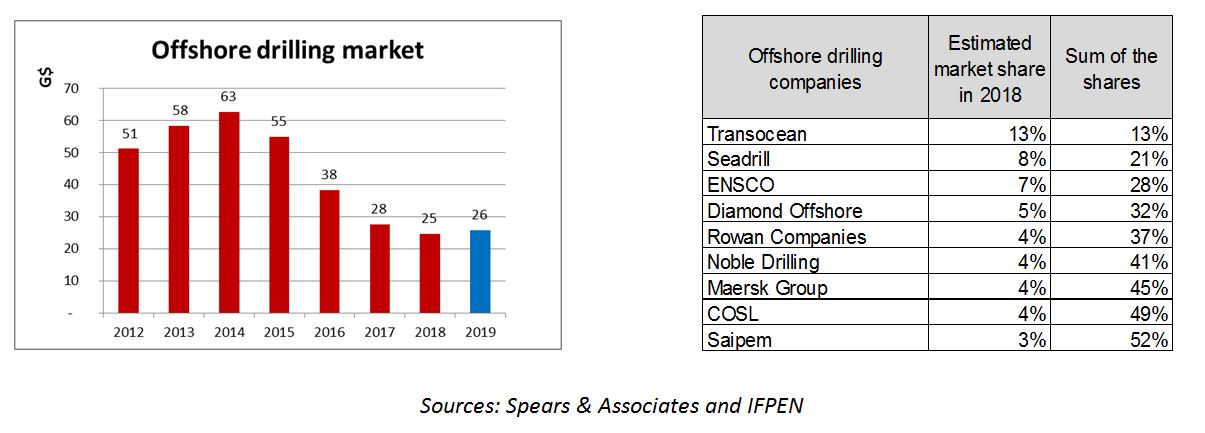
The turnover of the main players in offshore drilling continues to decline in 2018. Transocean, despite past difficulties, remains the market leader. In total, the nine largest companies in terms of turnover control 52% of the global offshore drilling market. This low cycle situation in offshore drilling is conducive to M&A operations. Ensco has announced that it will combine its fleet with Atwood, and Borr is buying Paragon. As a reminder, in 2017, Transocean bought Songa. These consolidations are intended to achieve economies of scale and increase market share; they should eventually reduce overcapacity and improve daily rental rates. In 2019, given the number of deferred projects awaiting development, the offshore drilling market should finally return to growth and grow by +5%.
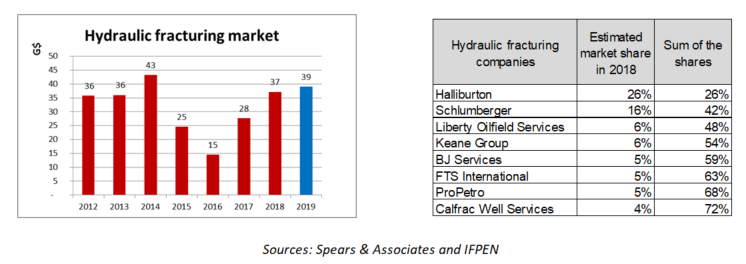
In 2018, the hydraulic fracturing market returned to pre-crisis levels. This is a highly concentrated market; three companies hold 50% of the market and 70% of the market is held by eight companies. Since the market bottom of 2016, the growth in turnover has been extremely strong, with a near doubling in 2017. The increase in the number of fractures along horizontal drains has led to a significant increase in well productivity and to the production of 8 Mb/d of shale oil in the United States by the end of 2018. In 2019, market growth is expected to be more modest at around 5%.
Geophysics in the world
Geophysics is upstream of the development of oil and gas fields and is an indicator of exploration activity. At the end of 2018, there was still no rebound in marine activity. Despite the continued reduction of the fleet (-10% in 2018) and the cessation of activity of a number of contractors, there is a fleet of 115 geophysical vessels worldwide that can record 2D and 3D seismic campaigns using OBC cables, OBN and electromagnetic nodes. However, less than one-third of the boats (31%) are in operation. The majority of vessels are inactive (37%), unarmed (28%), or in transit (3%).
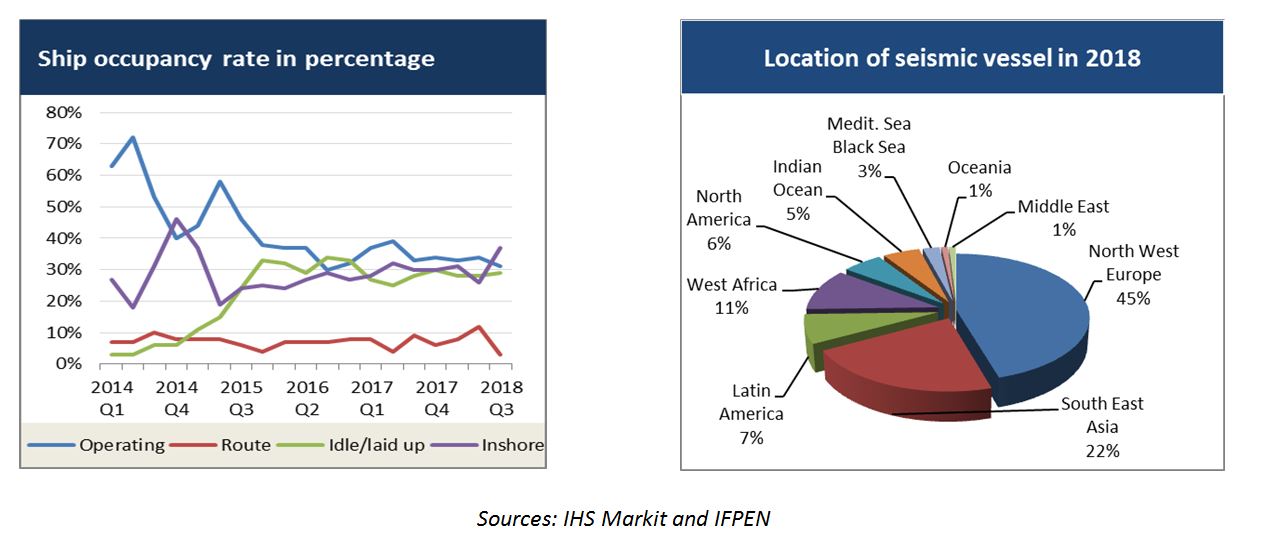
Most of the geophysical vessel fleet is located in five major regions where offshore activity is developed: North-West Europe (45%) with the North Sea, South-East Asia (22%), Latin America (7%), West Africa (11%) and North America (6%) with the Gulf of Mexico (GOM). Exploration activity in the Gulf of Mexico on the Mexican side remains reduced despite the reform of oil exploitation in Mexico. The growing geographical areas represent little activity in volume terms, namely the Indian Ocean (+25%), the Middle East (+20%) and North America (+13%). Northwest Europe and West Africa stagnated with respectively -3% and -2% activity over the year. South-East Asia gained 2%, but all other regions declined, particularly Latin America and Brazilian offshore exploration (-30%).
3D marine acquisitions represent half of the activity (50%) of boats. A significant proportion of boats (18%) are used as source boats for multi-azimuth campaigns. 2D seismic remains minor and represents only 13% of the activity. Specialized marine campaigns, using bottom-of-sea cables (OBC) and bottom-of-sea sensors (OBN), account for 7% and 5% respectively. Repeated marine seismic (4D) for seismic monitoring represents 5% of the activity. A 3D seismic is called 4D when it rigorously repeats the acquisition scheme of the first 3D seismic reference. Electromagnetic campaigns remain marginal (2%).
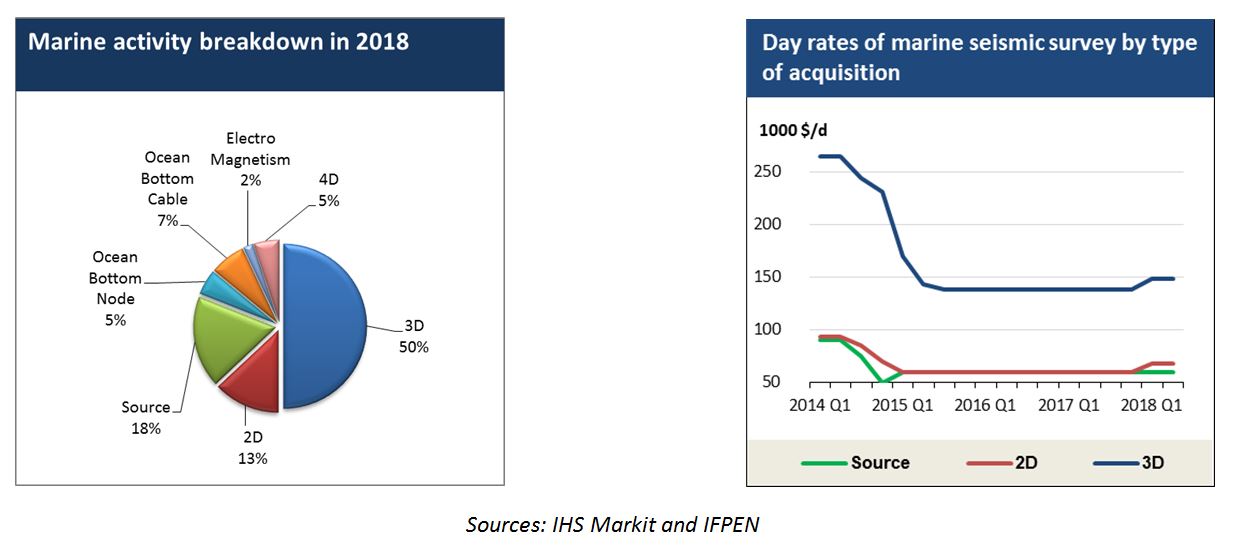
Except for a slight recovery in prices for the highly technical 2D and 3D marine campaigns (Very High Level), prices in 2018 are not increasing much: 13% for 2D and 13% for 3D. As a reminder, since 2014, prices have fallen by 40%. At the end of 2018, the average price of a 2D is $68k per day; for a 3D, it takes $150k a day. By way of comparison, the daily price of a boat is about $60k. The fleet's overcapacity in relation to demand remains. Contract acquisition activity remains weak, most campaigns are multi-client.
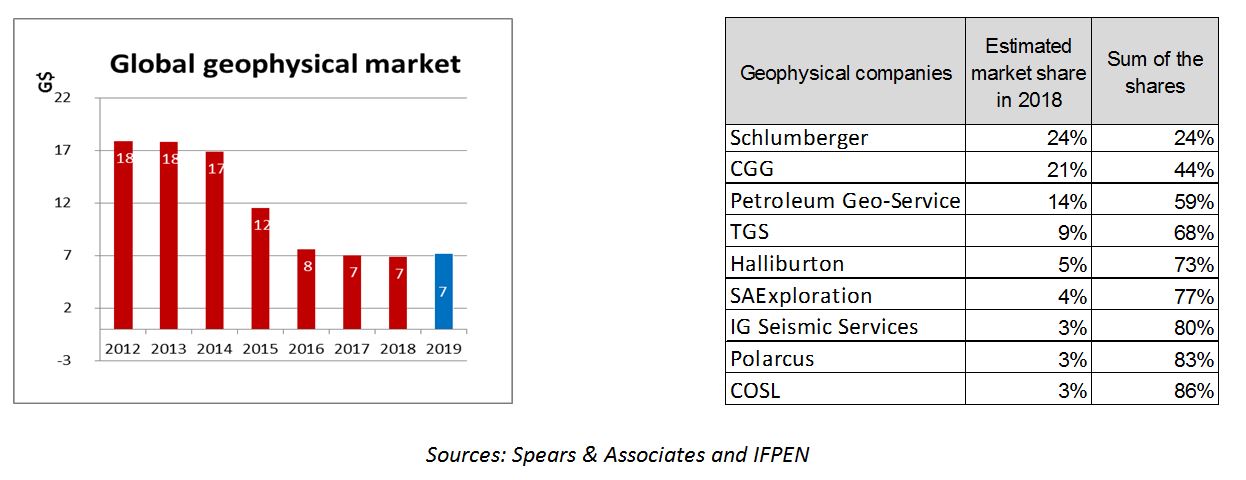
In 2018, global geophysics market revenue (all segments combined) is expected to be comparable to 2017 and around $7 billion. After three years of sharp declines, despite multiple reorganizations in the sector, the market rebound has still not taken place. Nevertheless, we are witnessing a stabilization of turnover, the weakest players have disappeared, only contractors who have succeeded in refinancing and restructuring remain. Smaller players see their turnover continue to decline, while the turnover of the top seven players, which alone represent 80% of the market, improves significantly by 5%.
After Schlumberger stopped its marine activity (WesternGeco), it is CGG's turn to stop the contractual seismic acquisition. Contractors continue to refocus on geoscience services activities and the sale of multi-client seismic data. TGS' business model has become the example to follow; Contractual acquisitions are no longer sufficient to justify a fleet of seismic vessels, it is more profitable for contractors to live off their seismic data libraries and multi-client acquisitions.
Activities in the geosciences sector are supported by a demand for high-end imaging processing for reservoir delineation and production. The areas explored and the issues addressed are increasingly complex and require sophisticated treatments.
The equipment sector stabilized in 2018 (-2%). The sale of ground equipment is benefiting from strong demand from the Middle East and Asia. Maintenance and equipment rental operations ensure a certain stability of income.
In 2019, we should finally see a return to growth (+5 to 10%), the last quarter of 2018 having seen a return to activity and a slight rise in prices.
Offshore construction in the world
Offshore represents 28% of hydrocarbon reserves and 28% of world production. The ¾ of the discovered volumes are particularly discovered offshore. This sector remains an essential sector for majors, it offers easier access to the exploitation of reserves than the onshore sector.
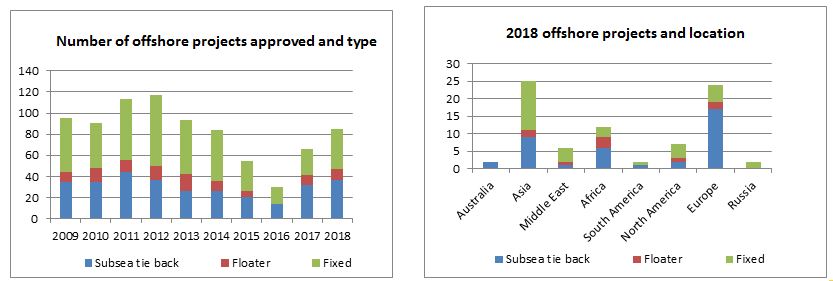
In 2018, the number of offshore projects approved increased by 29%. This is the second year of progress since the low point of 2016. Oil and gas companies, after having postponed their development projects, are confronted with the problem of maintaining their production. The return of the price per barrel above $60 makes the projects previously put on standby viable. 45% of the projects concern fixed platforms, 45% subsea projects and 10% floating platforms (FPU5 for deep offshore). Asia and Europe each represent 30% of global projects; while Asia prefers to develop its projects from fixed platforms, Europe carries out subsea developments.
At the global level, the largest increase in the number of projects comes from fixed platforms, which recorded a 50% increase. The number of subsea projects is up 15%, and the number of floating projects is up 10%. Among the 18 floating platforms deployed in 2018, FPSOs represent two thirds of production support. It is by far the most popular floating system, especially in China for its technical flexibility and fast production start-up. The TLP, Spar, Semisub and FLNG are each a few units.
With the rise of renewable energies, offshore wind energy now accounts for 14% of subsea construction vessel activity (support, ROV) in the North Sea. After Walney (659 MW) came on stream in 2012, Orsted plans to install 174 wind turbines on the Hornsea project by 2020, with a total production capacity of 1.2 GW. Equinor, which has also turned to renewable energies, plans to supply 35% of its wind energy to the 5 platforms of the Norwegian Gullfacks and Snorre fields. In Asia-Pacific, Taiwan plans to develop 5.5 GW by 2025 and India plans to develop 1 GW on the Gujurat coast.
The number of decommissioning projects in the North Sea is increasing with the number of end-of-life fields. It is estimated that there are 200 subsea wells to be dismantled in the North Sea, 90% of which are located on the United Kingdom's continental shelf. In the United States, there were 45 dismantling operations in the Gulf of Mexico in the last six months of 2018, with water depths rarely exceeding 300 meters and mainly involving jackups. But decommissioning also concerns floating wind turbines with the dismantling of the first offshore wind farm in Vindeby built in 1991 by DONG.
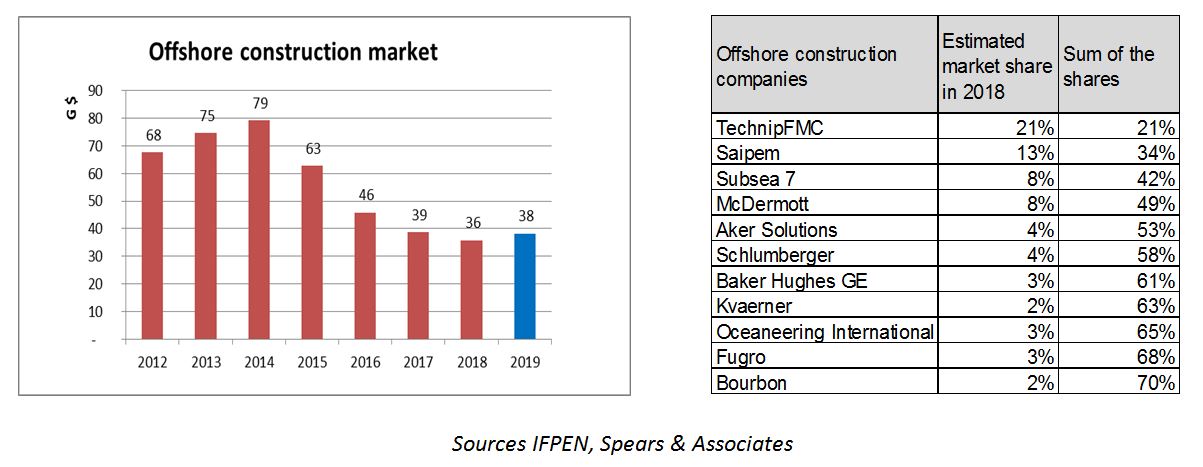
In 2018, despite the increase in the number of projects approved, the market for offshore construction and services is expected to decline by 8% in value compared to 2017 to $36 billion. This is the fourth year of decline; since 2015, this market has lost almost half (-45%) of its value. Four companies hold 50% of the world market. TechnipFMC is the leader with an estimated global offshore market share of more than 20%. The projects developed are carried out in a context of depressed service prices and are mainly focused on shallower, less capital intensive offshore. This does not allow the offshore construction market to rebound. By investing against the cycle, operators' interest is to minimize their investments.
In 2018, the subsea development market segment, which represents 30% of the total offshore construction revenue, fell by 13%; despite stronger demand, this segment remains impacted by lower prices. In the future, North Sea decommissioning operations are estimated at GBP 60 billion for the United Kingdom and could represent 25% of future subsea activity. The price of Oil&Gas services before 2015 was a barrier to operations given the large amounts to be invested; the number of projects has therefore accumulated.
More than half of the global offshore construction market (56%) comes from platform construction. All types combined (fixed, floating, FPU), this market fell in value by 7% compared to 2017, despite an increase in the number of units. The low utilization rates of the platform fleet, particularly for drilling, do not encourage a revival of construction.
The service and supply ship sector stabilized in 2018, with a slight growth of 5%. This market is less dependent on new developments, and depends on the maintenance and supply operations of existing platforms. For 2019, given the number of projects expected to start, the entire offshore construction market should return to growth and grow by 5 to 10%.
Geoffroy Hureau - geoffroy.hureau@ifpen.fr
Sylvain Serbutoviez - sylvain.serbutoviez@ifpen.fr
Draft submitted in February 2019
(1) BP, Chevron, Exxon Mobil, Shell and Total
(2) United States and Canada, with Mexico ranked in Latin America
(3) Barclays mid-year global upstream survey - 31 August 2018
(4) DUC (Drilled UnCompleted)
(5) FPU: Floating Platform Unit, storage, liquefaction or production platform