

01.04.2017
30 minutes of reading


The Paris Agreement signed at COP21 came into effect in November 2016. This agreement aims to hold the increase in global average temperature to below 2°C and pursue efforts to limit the rise to 1.5°C by 2100. Governments and local jurisdictions must now implement an economic and regulatory framework to encourage greenhouse gas reductions. One of the economic tools available is carbon pricing. It varies greatly in form and value at international level and is deployed in all sectors of the economy.
At COP21, almost every government1 confirmed its commitment to controlling greenhouse gas emissions (GHG). These commitments are known as Intended Nationally Determined Contributions (INDCs)2 and are subject to the United Nations Framework Convention on Climate Change (UNFCCC). The implementation of 160 INDCs is based on a range of national policies and programmes to reduce greenhouse gas emissions, over 50% of which (89 INDCs) include the use of carbon financing mechanisms (Fig. 1).
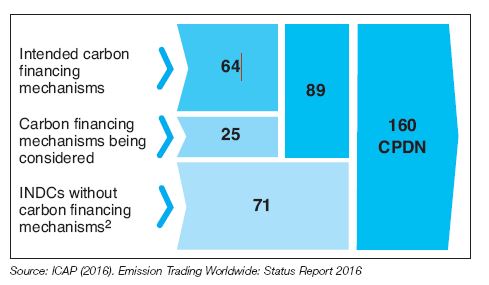
mechanisms
Economic tools for carbon pricing are not set in stone, in fact quite the opposite. Article 6 of the Paris Agreement provides a framework for diversifying carbon pricing and opens the way for new financial instruments currently being
defined. These new instruments will supplement the existing instruments: the emissions trading schemes (ETS) and carbon taxes, which were introduced over 10 years ago.
Regulatory carbon financing systems
Emissions trading schemes and carbon taxes
In 2016, 40 national jurisdictions3 and 24 cities, States and regions had regulated carbon pricing. This regulated pricing is primarily achieved using two tools implemented by regional or national governments: the ETS and the carbon tax.
The ETS is the most widely deployed tool at global level with a total of 44 initiatives out of the 644 listed5. Used alone, the carbon tax is the least widely adopted6; to date there are only four initiatives using it. Lastly, it is common to combine an ETS and a carbon tax within the same jurisdiction when sectoral reduction costs differ greatly. Of the 64 existing initiatives, 16 involve a combination of an ETS and a carbon tax7 (Fig. 2).
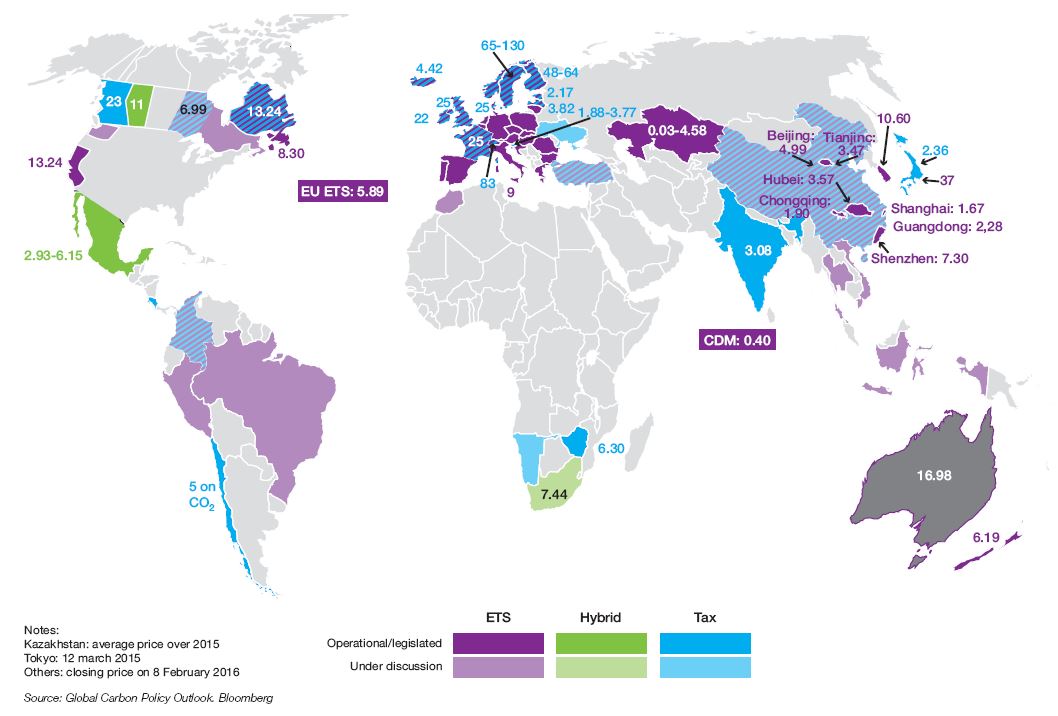
In 2016, GHG emissions covered in this way by an ETS and/or a carbon tax represented 13% of total global GHG emissions, i.e. 7 GtCO2e8, a significant rise over the past 10 years.
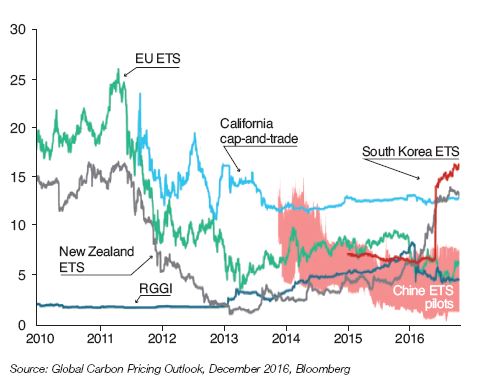
In 2016, the price of carbon varied from $1-130/tCO2e across all the existing regulated systems (Fig. 2). Finland has the highest carbon tax at $130/tCO2e. In December 2016, the price of the carbon allowance under the Korean ETS was the highest in the world at over €15/tCO2e (Fig. 3). With the launch of its national ETS scheduled for 2017, China will be the world’s largest carbon market in volume, involving over three billion tonnes of GHG emissions compared with slightly under two billion tonnes for the European emissions trading scheme.
The proliferation of ETSs and carbon taxes is enabling jurisdictions to collect additional financial resources. However, these tools are only effective in reducing GHG emissions if the price level genuinely impacts the investment decisions of economic agents. Existing carbon trading schemes generally have an overly abundant offering of carbon allowances, leading to a relatively low tCO2e price.
To prevent the carbon allowance price from falling too low, California and the UK set a floor price for the carbon price9 enabling them to guarantee a minimum price. Of all the world’s main ETSs, only the prices of the Korean, Californian and New Zealand allowances increased in 2016, at above €10-15/tCO2e. Globally, allowance prices are highly volatile, which regularly raises the issue of a floor price as proposed by France in 201610.
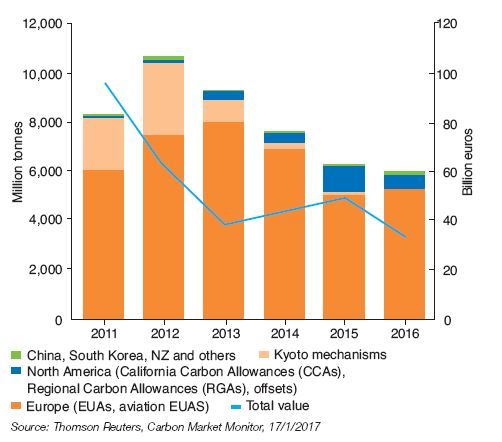
The total value of these carbon trading schemes fell by 31% in 2016 however, to €34 billion, almost twice the GDP2013 of the United States (Fig. 4).
This drop in the total value of the regulated market is due mostly to the drop in the European Union allowance (EU11) price, which fluctuated between €4-7/tCO2e throughout 2016. The decrease in the European allowance price reflects the chronic oversupply of allowances in the European system despite the implementation of structural market reforms in 201412. This oversupply of allowances is attributable not only to the economic crisis but also the overlapping of renewable energy and energy efficiency targets, which are reducing the demand for allowances even further.
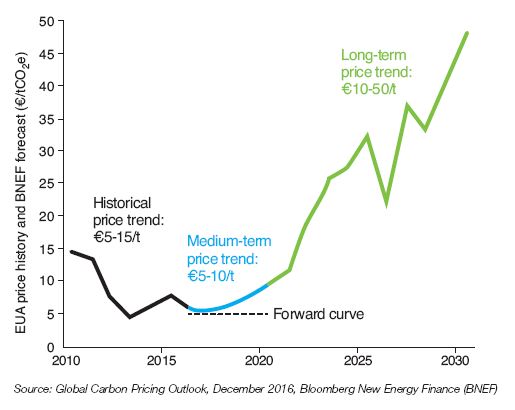
A draft law published by the Commission in July 2015 with the aim of amending the ETS Directive for Phase IV (2021-2030) is under discussion in Brussels. Over the next five years, EUA13 price expectations should remain at around €5- 10/tCO2e. The proposed amendments to the ETS Directive will only apply from 2019 and, all things being equal, should progressively reduce the market surplus, driving the European Union allowance price to around €45/tCO2e by 2030 (Fig. 5).
Other voluntary private initiatives
Alongside the regulated carbon pricing schemes (ETSs and carbon taxes), there is a wide variety of voluntary private initiatives that are gaining acceptance at international level. These voluntary initiatives group voluntary carbon offset schemes and internal carbon prices together in businesses.
jurisdictions
Voluntary carbon offset schemes
The voluntary carbon offset markets apply to GHG emission reductions in sectors outside the scope of regulated emissions. The voluntary demand for carbon credits arises mainly in businesses and among individuals wishing to offset their actual GHG emissions over and above any regulatory obligation. Whilst initially this voluntary offsetting was mostly adopted by companies with a strong carbon ethic or a “green” brand image to preserve, the COP21 framework has probably opened the way for new international carbon credit trading instruments.
In 2015, purchases of voluntary credits totalled 84.1 MtCO2e, a 10% increase in volume over 2014 (Fig. 6). Since 2005, almost 330 MtCO2e of voluntary carbon credits have been put on the market. The volume of voluntary carbon credit
transactions is modest compared with the regulatory markets (7 GtCO2e).
The average trading price of $3.3/tCO2e seen in 2015 resulted in a total market value of $278 million in carbon offset credits, slightly down against 2014, a year in which trading delivered $298 million. This contraction was partly linked with the decrease in the average price of carbon credits.
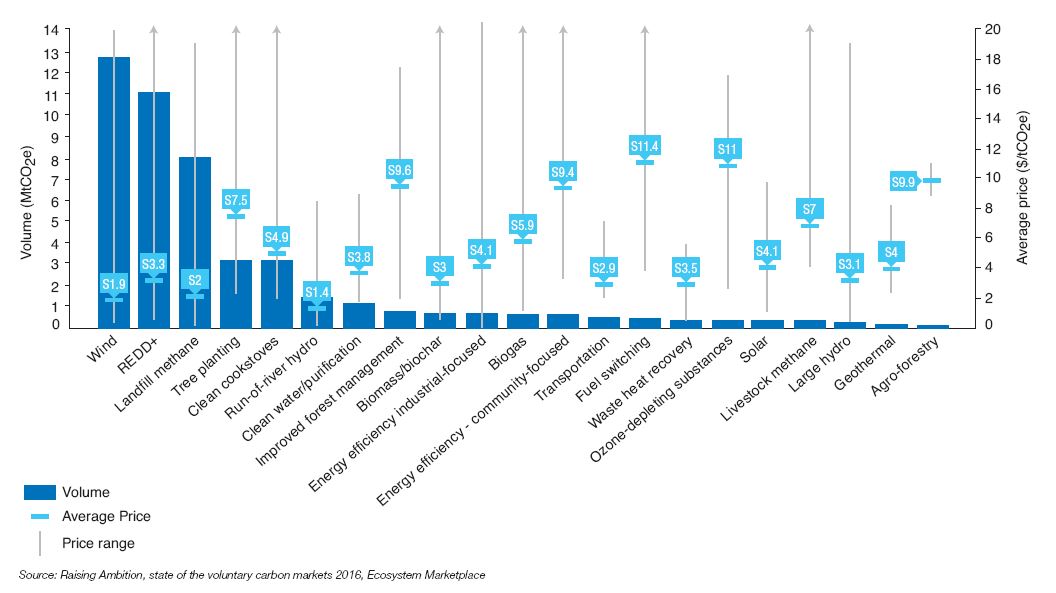
There is not, however, a single price for voluntary carbon credits that applies to all those involved in a scheme. Prices of voluntary carbon credits vary significantly and depend on the GHG reduction projects with which they are associated. The lowest transaction price registered was $0.1/tCO2e and the highest, $44.8/tCO2e. Prices of carbon offset credits vary according to the location and type of project, the certification standard used and the volumes of credits generated by a reduction project. The higher the number of carbon offset credits generated by a project and registered under a recognized standard, the lower the margins accepted by the credit sellers, who make their profit on the volume of credits sold (Fig. 7). In 2015, nearly 50% of carbon offset credit transactions took place at a price of under $3/tCO2e, and only 12% of transactions at over $6/tCO2e14.
Almost 98% of carbon offset credits bought were certified according to a standard delivered by an independent third party. Consequently the Verified Carbon Standard (VCS) was the most sought-after standard among buyers with an almost 50% market share and an average price of $3.2/tCO2e, followed by the Climate Action Reserve (CAR) (20% market share at an average price of $2.6/tCO2e), the Gold Standard (19% market share at $4.3/tCO2e), the American
Carbon Registry (ACR) (3% market share) and lastly the Plan Vivo standard (1% market share).
In 2015, unlike the previous years, there were more carbon offset credits from wind energy generation projects than credits from emission reduction projects relating to deforestation and forest degradation (REDD+), partly due to the lower price of wind carbon offset credits and the larger volumes generated.
At international level, the United States was the largest supplier and consumer of carbon offset credits with 15.4 MtCO2e of credits. Certain types of carbon credits are accepted under the Californian ETS to bring companies in on this market. At a global level, the offering of carbon offset credits comes mainly from India (6.6 MtCO2e), Indonesia (4.6 MtCO2e), Turkey (3.1 MtCO2e), Kenya (3.1 MtCO2e) and Brazil (3.1 MtCO2e).
From a sectoral point of view, energy, transport, finance and insurance are the main buyers of carbon credits.

Nevertheless, despite a 10% rise in world demand for carbon offset credits in 2015, the offering remained greater than demand and nearly 55.9 MtCO2e of additional carbon credits remained unsold. To this is added the additional anticipated offering for 2016 estimated at 70.4 MtCO2e, originating mainly from GHG emission reduction projects relating to land use and forestry, and renewable energy facilities.
Obviously, the carbon offset credit market is not limited by the offering of credits as this is abundant, but rather by the demand for carbon offset credits.
The situation could however change with the application of the Paris Agreement and the International Civil Aviation Organisation (ICAO) initiative.
ICAO offset credits
Negotiations under way within the ICAO will lead to an increase in international demand for carbon offset credits by 2020. Because the ICAO has set itself the voluntary target of neutralizing its CO2 emissions from 2020 and because technological advances15 and the rationalization of processes16 will not be sufficient to offset international civil aviation emissions, carbon offsetting will be implemented within the CORSIA17. The ICAO estimates that in order to hold the CO2 emissions of civil aviation at its 2020 level, it will need to buy close to 852 MtCO2e of carbon credits between 2020 and 2035. However, carbon credits that will be accepted by CORSIA in the future will need to comply with extremely strict eligibility criteria currently being defined by ICAO.
Lastly, alongside these voluntary carbon offset schemes, there are private initiatives within companies that entail the setting of an internal price for carbon. Private initiatives demanded by companies attentive to the carbon emissions pricing dynamic.
Internal carbon price in a company
A company can voluntarily set an internal carbon price in the form of a tax or base price, thereby revealing the economic cost of its GHG emissions. The shadow price gives a cost to a project’s GHG emissions, enabling investment
decisions and R&D to be directed towards low-carbon technologies. In the long term, the base carbon price is a tool to reduce a company’s systemic carbon risk in the face of climate policies.
The internal carbon tax immediately gives a price signal to operating departments emitting GHGs. In return, the collection of this tax enables the financing of investments in technologies emitting fewer GHGs, engendering a drop in emissions in the long term. A virtuous circle is therefore created.
A business will choose a tax or shadow price in accordance with the nature of its activities (depending on the volume of GHGs it emits) and its internal GHG reduction policy. Establishing an internal carbon price requires the company’s GHG emissions to be calculated in advance using a Bilan Carbone™-type process in order to identify the items emitting the most GHGs and the levers to implement. In fact, it is important to be able to measure the impact of an internal carbon price (tax or shadow price) on investment decisions and energy consumption in the long term.
In parallel, businesses must be able to calculate their implicit carbon price (the actual cost of decarbonization). This carbon price is calculated after the event using the cost of the measures and actions implemented to reduce the emissions compared with the reductions actually obtained. The company also calculates its investment cost per tonne of GHG prevented, an indicator of the cost of the reduction that is important for setting the shadow price or carbon tax.
At global level, according to a study by CDP18, over 1,200 companies acknowledged using an internal carbon price or are considering doing so in the next two years, a strong increase over the 150 identified in the 2014 study.
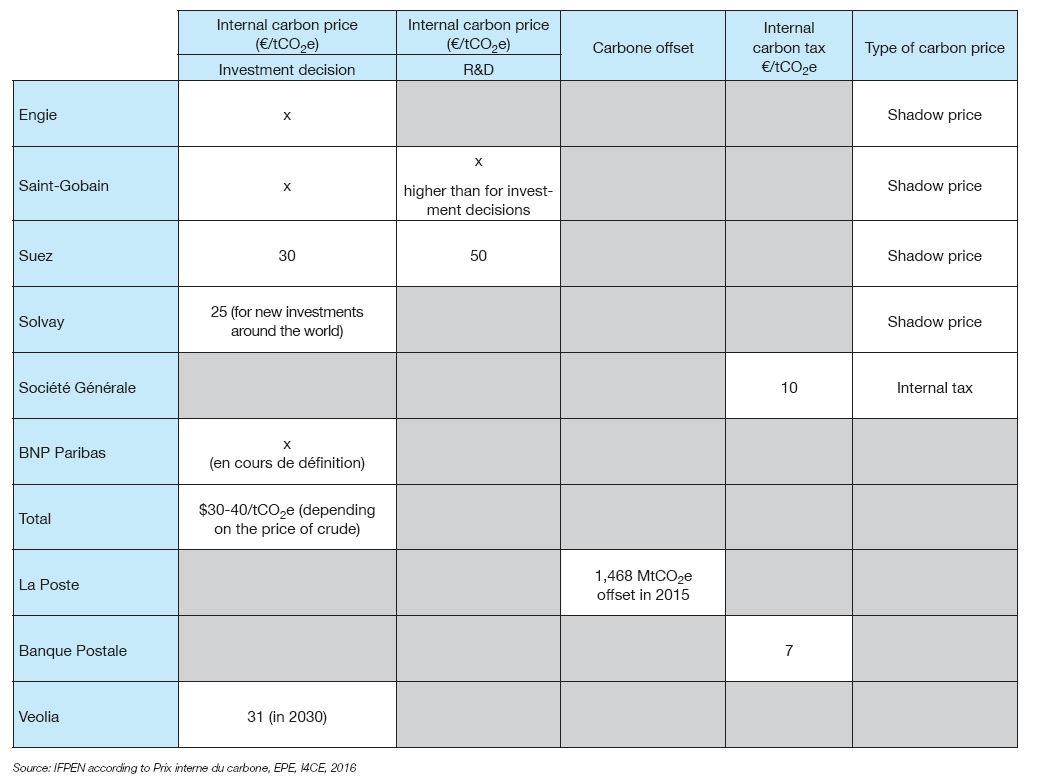
In France, a number of industrial groups and services companies have revealed their internal carbon price19. This is generally higher than the carbon price under the EU ETS, expressing an aversion to climate risk on the part of companies. It should be noted that the internal carbon price applied to R&D projects (by Saint-Gobain and Suez for example) is decidedly higher than the internal carbon price used in calculating the profitability of new investments (Fig. 8).
Conclusions
The Paris Agreement, which came into effect in November 2016, opened the way for a proliferation of carbon pricing initiatives at international level.
Whether through regulated schemes (ETS, carbon taxes) or voluntary schemes (internal carbon prices), international carbon pricing is being used by an increasing number of economic actors.
The proliferation of these initiatives is leading to an increase in the number of values for carbon. To remain competitive in the markets and/or avoid penalties relating to their GHG emissions, economic actors should know the sectors covered, the constraints and how they function, and the level of carbon price to which they are subject.
Financing the energy transition requires the definition of public policies to orientate companies’ investment strategies and foster research and development in low-carbon technologies. By superseding the Kyoto Protocol and doing away with the dichotomy between Appendix-1 and non-Appendix-1 countries, the Paris Agreement has opened the way for new carbon pricing tools at global level.
Paula Coussy – paula.coussy@ifpen.fr
Final draft submitted in April 2017
(1) 162 of 189 countries signing the Paris Agreement. The signatory countries produce 96% of global greenhouse gas emissions and contain 98% of the world’s population
(2) INDC: Intended Nationally Determined Contribution
(3) Within a federation of States
(4) ETS only: EU-ETS (2005), New Zealand (2008), RGGI (2009), Tokyo ETS (2011), California (2012), Quebec (2013), Kazakhstan (2013), Korea (2015), Ontario (2017), etc.
(5) State and trends of carbon pricing, World Bank Group, 2016
(6) Tax only: Finland (1990), Sweden (1991), Japan (2012), Mexico (2014); in progress South Africa (2017), Chile (2017), Canada (2018), etc.
(7) Norway, Switzerland, Ireland, France, Portugal, etc.
(8) CO2e: CO2 equivalent. Refers to the global warming potential of greenhouse gases in CO2 equivalent
(9) $10/tCO2e for California and nearly £20/tCO2e for the UK in 2017
(10) Mission report “Propositions pour des prix du carbone alignés avec l’Accord de Paris”, P. Canfin, G. Mestrallet, A. Grandjean
(11) EUA: European Union Allowances
(12) Reforms called Backloading and Market Stability Reserve (MSR) intended to reduce the offering of allowances under the EU ETS
(13) Bloomberg New Energy Finance. Dec. 2016
(14) Raising Ambition, state of the voluntary carbon markets 2016, Ecosystem Marketplace, p. 6
(15) Including the energy efficiency of aircraft engines and the use of biofuels
(16) Such as the optimization of flight paths
(17) Carbon Offsetting and Reduction Scheme for International Aviation (CORSIA)
(18) CDP, Embedding a carbon price into business strategy, 2016 (non-profit-making organization)
(19) Internal carbon price, EPE, I4CE, 2016