

01.02.2018
30 minutes of reading


Global gas market fundamentals have trended upward during 2017, particularly in China where growth in supply and demand for gas exceeded expectations. A number of factors, whether economic, regulatory or environmental, fostered greater demand for gas. However, the industry continues to suffer from a lack of investment, which could limit growth of the market in the 2020s.
The role of natural gas in the global energy mix
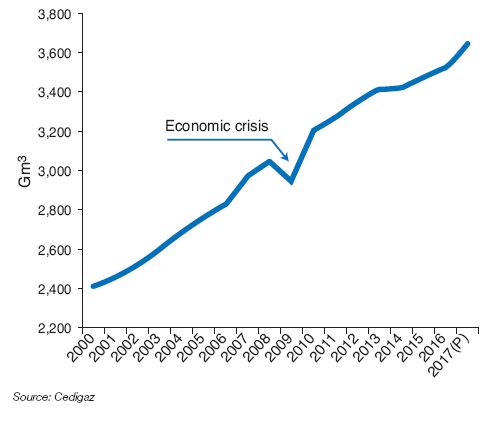
The opening up of markets and competition between fuels is gaining intensity in an increasingly competitive environment. Growth in natural gas consumption has slowed since 2010 (Fig. 1). From 2.7%/year in the 2000s, the average annual growth rate fell to 1.7%/year for 2010-2016, before sharply rising in 2017. But, on the whole, the proportion of gas in the energy mix has remained relatively stable over the past 12 years. Greater energy efficiency and competition from other energy sources, especially in the electricity sector, explain these trends.
Intense competition between natural gas, coal and renewable energies continued during 2017. On a global scale, the economic recovery is gaining strength and gas consumption continues to rise, reaching 3% for the first three quarters of 2017 compared with the same period in the previous year. But, at the same time, global coal consumption increased at a similar rate, driven by growing demand in Asian countries. In China, coal consumption began to rise in 2017, following three years of decline.
This increase is tied to growing demand for electricity (+7%). Coal, which remains more accessible than other fuels, is predominant in the power generation sector.
Against this background, the proportion of gas in the energy mix should remain at 22% in 2017, far behind oil (32%) and coal (27%). Renewable energies continue to gain ground, benefitting from lower costs that make them increasingly competitive. In the IEA’s most recent report on renewable energies1, the increase in power generation from renewable sources over the next five years will double the growth of coal and gas combined.
However, the aggregate volumes conceal a wide range of regional gas trends and energy substitutions.
Regional trends in demand for gas
A number of factors contributed to rising global demand for gas in 2017. As in 2016, Europe and China posted the strongest growth.
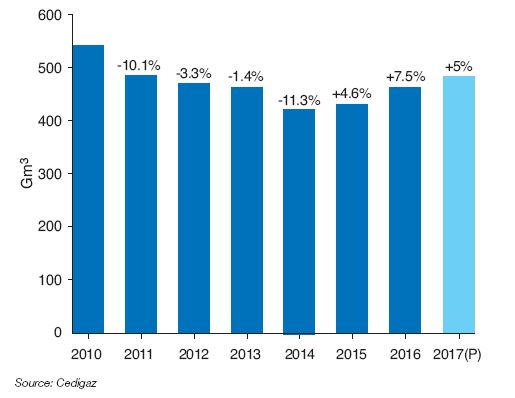
For the third consecutive year, European gas consumption rose sharply in 2017, provisionally estimated at 5% following a period of constant decline from 2010 to 2014 (Fig. 2). Falling gas prices fueled the recovery in demand for gas.
Chinese policy aimed at limiting coal production also drove up coal prices, making gas more competitive in Europe. This is especially true in the United Kingdom, due to a carbon tax of €21/tCO2. The main factors that impacted European demand for gas in 2017 were:
- cold snaps (increased need for heating),
- the gradual economic recovery,
- the need to offset shutdowns of certain coal-fired power plants,
- declining production of French nuclear power stations,
- decline in hydraulic production,
- the growing use of natural gas in the transport sector.
However, European gas consumption has not returned to its peak recorded in 2010. In the future, natural gas will continue to gain market share in the electricity sector to the detriment of coal, due to new regulation of pollutants emitted by the power sector and the scheduled shutdown of coal-fired plants in some countries, such as the United Kingdom and Italy.
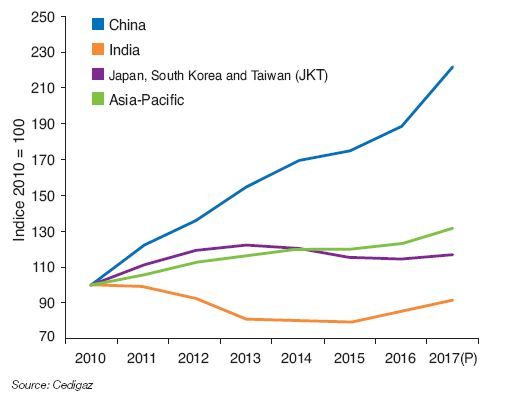
At the international level, China posted the greatest increase in demand for gas, in absolute terms. Preliminary estimates by Cedigaz show record growth of 18% (+ 35 Gm3) in 2017, double the average growth rate seen in 2010-2016 (Fig. 3). This resulted from an energy policy founded on the substitution of coal with low-carbon or carbon-free fuels to reduce pollution. In particular, there has been a broad shift from coal to gas in the residential sector. The government intends to promote the use of cleaner energy for heating in the northern part of the country in order to reduce the number of smog alert days. Below-normal winter temperatures in 2017 have increased demand for heating, thus reinforcing the seasonal nature of Chinese demand for gas.
In many African and Middle Eastern countries, gas has continued its rapid growth in the electricity generation sector.
In addition, 2017 has seen trends reverse in certain high-consumption countries. After several years of decline, gas consumption began to rise in Russia, driven by demand for heating and the resumption of industrial activity. In South Korea, the 2017 rebound in gas consumption mainly resulted from a decline in nuclear production.
In the United States, gas consumption posted an unusual drop in 2017, following seven years of strong growth. The proportion of natural gas in the electrical mix declined in favor of renewable energies, against a backdrop of higher gas prices. Electricity production from renewable sources has risen sharply in the country since 2016. In 2017, it is estimated that around one-half of additional installed electrical capacity was composed of renewable energies, such as solar and wind power.
Sharp rise in production capacity and supply
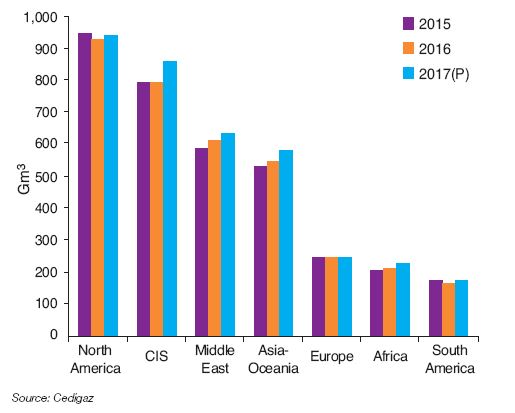
Worldwide gas production jumped 4% over the first three quarters of 2017, according to preliminary estimates by Cedigaz (Fig. 4). Several major producer countries increased their production capacity in 2017. This trend is expected to continue in the coming years.
In Russia, natural gas production rose sharply in 2017 — by 8% according to provisional estimates — in order to support the strong growth of exports and domestic demand. The Yamal LNG project in the Siberian Arctic officially opened on 8 December 2017. It will have three trains of 5.5 Mtpa each. The second train is expected in October 2018, with the third arriving in 2019. Numerous other projects, including those operated by Novatek in the same region, will significantly increase Russian production and export capacity.
Since 2014, the country has significantly increased its exports to Europe, and its European market share continues to rise. This trend is the result of Gazprom’s business strategy, which has kept the price of Russian gas competitive. In addition, Gazprom secured improved access to the German gas pipeline Opal, which carries gas to Central Europe via the subsea Nord Stream gas pipeline. This enabled the company to expand its supply capacity.Fig
In the United States, drilling and production of shale gas regained momentum, especially in Pennsylvania (Marcellus field). The construction of new gas pipelines in the Appalachian regions promotes the connection to production and consumption centers, as well as the sale of shale gas reserves. In addition, production from the Haynesville field (Louisiana) has increased rapidly, matching its record set in 2013. In a low-price environment, U.S. operators have shown remarkable responsiveness, lowering costs and increasing productivity of shale gas wells.
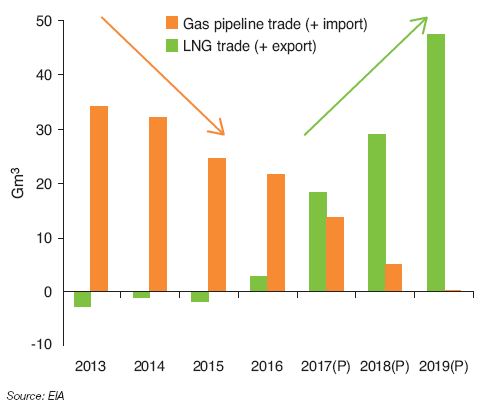
During 2017, the United States moved from a net importer to an exporting country. According to the Energy Information Administration’s (EIA) January 2018 projections, net exports of liquified natural gas (LNG) rose by 15 Gm3 in 2017, while net imports by pipeline fell 8 Gm3 (Fig. 5). In addition, total net exports rose sharply over the short term, increasing from 4 Gm3 in 2017 to 24 Gm3 in 2018 and 47 Gm3 in 2019.
In Africa and the Middle East, gas production was recently boosted by the development of new projects. Since 2016, production in Algeria was boosted by the installation of compression capacity in the Hassi R’mel gas field, as well as the gradual start-up of gas projects in the southwest of the country. In Egypt, production began to rise following seven years of decline, due to the commissioning of the West Nile Delta project. The massive Zohr offshore gas deposit began production in December 2017. In addition, production testing began on the Atoll offshore field in the eastern Nile Delta. Egypt plans to become self-sufficient over the short term thanks to the growth of these various projects.
Noteworthy in 2017 was Qatar’s announcement that it would lift the moratorium on development of the massive North Field deposit, to achieve a 30% increase in national gas production by 2024. Qatar will remain strong competitor in the LNG market, with plentiful supply and costs that rank among the world’s lowest. In Iran, production capacity at the giant South Pars gas field continues to rise with the commissioning of new production phases. At present, with the exception of six of them, the deposit’s 24 development phases are fully or partially operational. Investments have also been made to limit decline of the initial phases. Iranian production is mainly intended for the local market.
In Latin America, regional production is driven by gas operations related to Brazil’s pre-salt offshore fields.
In Europe, Norwegian production rose by 7% in 2017 to reach record levels. The country is continuing to expand production at the Troll gas field, allowing it to increase exports to the United Kingdom. These recent developments in terms of supply will be decisive in securing and diversifying supply while limiting market tension. However, the geopolitical aspects of the gas market must be kept in mind. One should not rule out uncertainties that could reshuffle the deck (Middle East, Russia, etc.).
The LNG industry, driving growth in the gas market
LNG is currently the most dynamic sector of the gas industry. This market, which is becoming denser and more flexible, supports the growth of natural gas and improves security of supply.
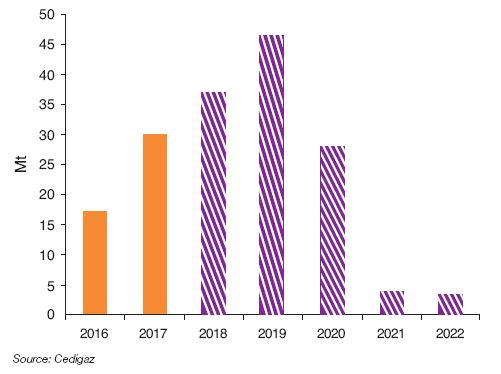
2016 highlighted the start of a new wave in the expansion of LNG supply (+7%). It gained intensity in 2017, with an additional gain provisionally estimated at 30 Mt (+11%), the sharpest increase recorded since 2010. Approximately 40% of this growth is attributable to Australia, and more than one-third to the United States. Note the commissioning of the Australian projects Gorgon 3 and Wheatstone 1, as well as the launch of trains 3 and 4 at Sabine Pass in the United States. The growth in LNG supply should continue its acceleration during 2018 and 2019 (Fig. 6).
China alone absorbed approximately 40% of additional LNG supply during 2017 to meet the sharp rise in its domestic demand. LNG was more favorable when compared with imports via pipeline, which were less competitive. China overtook South Korea to become the world’s second largest LNG importer, behind Japan.
Markets in South Korea and Taiwan also proved buoyant. In these countries, LNG was able to offset the shutdown of certain nuclear power plants. In the closing months of the year, India also increases its purchases of LNG because of a coal shortage.
Together, these developments led to a shift in LNG trading from the Atlantic Basin to the Asia-Pacific region. Qatar sharply increased its exports to China and Pakistan, while deliveries to the United Kingdom fell for the second consecutive year.
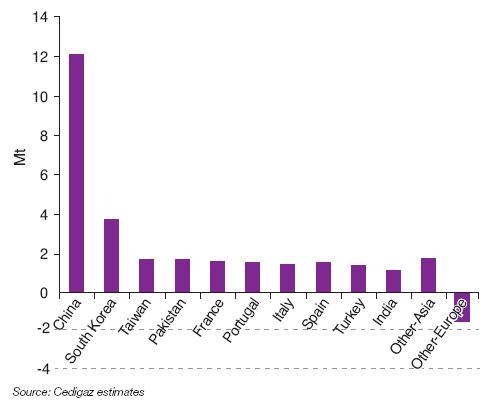
As in 2016, and contrary to the predictions of several analysts, there was no appreciable LNG surplus on the international market in 2017. Any surplus would have found a buyer in Northwest Europe, as this region has significant LNG import capacity and could also displace pipeline gas imports. But this was not the case and, in fact, Southern European countries sharply increased their purchases of LNG (Fig. 7).
The Asian LNG market was under tension during the final months of 2017, evidenced by the sudden rise in spot prices. The market remained tight until the end of winter 2017-2018. This was especially due to China, which continued to increase its gas consumption for heating as a replacement for coal, while the country was experiencing a very cold winter.
Expansion of the LNG market has been characterized by a growing number of importing countries. Floating regasification and storage units have opened up new prospects. Since 2015, eight new importing countries have entered the international scene: Egypt (2015), Jordan (2015), Pakistan (2015), Lithuania (2015), Poland (2015), Colombia (2016), Jamaica (2017) and Malta (2017).
Recent developments in the LNG market have led to increased spot liquidity and trading. The number of swaps has risen sharply, along with spot purchases, demonstrating the expanding role of LNG as a commodity in an increasingly global and flexible market. Traders have a growing presence in the gas industry, taking advantage of new opportunities in the market while developing risk management models across the entire LNG chain.
Trends in natural gas prices
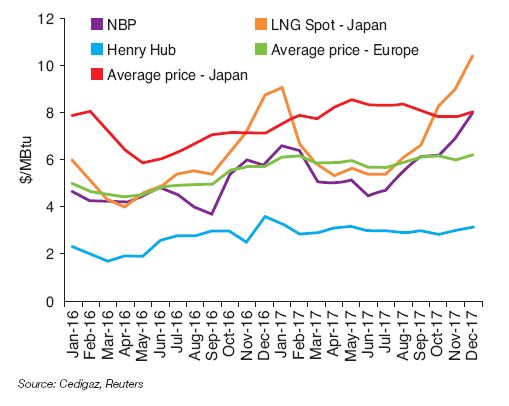
Gas prices, whether or not indexed to the price of oil, have risen during 2017 (Fig. 8). Various factors are driving this trend:
- the increase in oil and coal prices,
- considerable growth in demand for LNG in Asia (Northeast Asia),
- U.S. market rebalancing resulting from rising LNG exports,
- increased demand in Europe.
The discrepancy between Asian and European spot prices rose sharply in the last quarter. Spot prices in Asia have soared due to winter demand in China, combined with tensions in South Korea and India, while market liquidity was limited. Tensions were also felt in the European market during December due to a cold snap, a shortage of LNG in Northwest Europe, an explosion at the Baumgarten hub in Austria and a pipeline incident in Great Britain. In December 2017, the Japanese spot price and the NBP (UK National Balancing Point) were at $10 MBtu and $8 MBtu respectively, their highest levels since winter 2014-2015.
Balance in the gas market increasingly influences international natural gas prices, since the proportion of purchases billed at the spot price rises in Europe and in Asia (China). In Europe, the average price of gas imports indexed to oil prices and spot prices reached an average of nearly $6/MBtu in 2017.
Insufficient investment against a backdrop of uncertainty
Available natural gas resources do not limit the ability to meet demand in the coming decades. But the lack of investment in the sector, specifically in transport infrastructure, and the development of new fields could increase risk to supply and trigger future tensions in the gas markets.
During 2017, just one final investment decision was made for a liquefaction project, at the Coral project in Mozambique (Fig. 9). While the LNG market is increasingly uncertain and competitive, buyers show little inclination to sign long-term supply contracts, which remain necessary to finance capital-intensive projects. LNG suppliers are exploring new business and contractual structures to better distribute risk throughout the gas chain. Shortterm and medium-term contracts with flexible quantities, destinations and pricing formulas are increasingly desirable. However, these commercial developments are likely to delay investment decisions on new extraction and transport projects.
%20on%20LNG%20liquefaction%20projects.JPG)
The lack of investment reflects uncertainty about future demand for gas. Such demand is dependent on the competitiveness of renewable energies, and in certain countries, the competitiveness of coal for power generation. Without market price competitiveness, the future growth of natural gas in the energy mix will greatly depend on the creation of political and regulatory incentives to promote the substitution of gas in place of coal.
Balance in the gas market
Given the growing supply of LNG expected in 2018 and 2019, there are many questions regarding the speed in which the market may regain balance. The drop in investment may lead to a lack of production during the 2020s. According to Cedigaz’s reference scenario, prolonged tension in the global market may begin in 2023, based on projected growth in global demand for natural gas and LNG of 1.6%/year and 5%/year respectively between 2015 and 2025.
The 2017 summary shows the market rebalancing with sustained demand in Asia. This pace may accelerate if Asian demand, driven by China, continues to soar. According to the most recent five-year plan for China, more than two-thirds of growth in Chinese energy demand will be met by non-fossil fuels and natural gas between 2016 and 2020. The share of coal may decline to less than 58% of the energy mix by 2020 (versus 64% in 2015). In India, the government aims to increase the proportion of natural gas in the energy mix from 6% to 15% over the next three to four years, and to double LNG regasification capacity over the same period. The national company GAIL plans to double the current capacity of its pipeline network by 2020. Construction has already begun in the northeast provinces.
However, in both countries, there are limits to the substitution of gas for coal, due to economic and social circumstances. In addition, the current lack of infrastructure is slowing development of the gas market. In South Korea, the new long-term energy plan aims to reduce dependence on coal and nuclear energy and give greater priority to natural gas and renewable energies.
Conclusion
Gas-related activities have continued to grow, sustained by positive supply and demand factors. These positive signals point to sustained growth over the next five years, though at a slower pace than in the previous decade. Ongoing changes in China show the potential for major growth of natural gas in emerging markets.
A well-supplied gas market over the short term must not conceal the longer-term challenges. Midstream (transport, storage and trading) plays an increasing role in the growth of the gas industry, requiring significant capital investment. However, the long-term expansion of the gas markets may be limited by a lack of investment. Controlling the costs of gas projects will be crucial to the future expansion of natural gas in the energy mix. The challenge is to support the rise of renewable energies as part of the transition to a sustainable energy mix.
Armelle Lecarpentier – armelle.lecarpentier@ifpen.fr
Final draft submitted in February 2018
(1) Renewables 2017 (AIE)