

20.02.2020
30 minutes of reading


As was the case in 2018, the demand for natural gas grew significantly in 2019, on the back of an abundant and competitive supply promoting the use of natural gas for electricity production. The LNG sector performed outstandingly well in terms of sales volume and investments. Increasingly, LNG is influencing market and price evolutions. At a time when environmental concerns relating to the impact of natural gas on global warming are increasing, a growing number of players, both private and public, have been turning to the decarbonization of natural gas.
2019 saw sustained growth in the consumption and supply of natural gas, driven by the American market
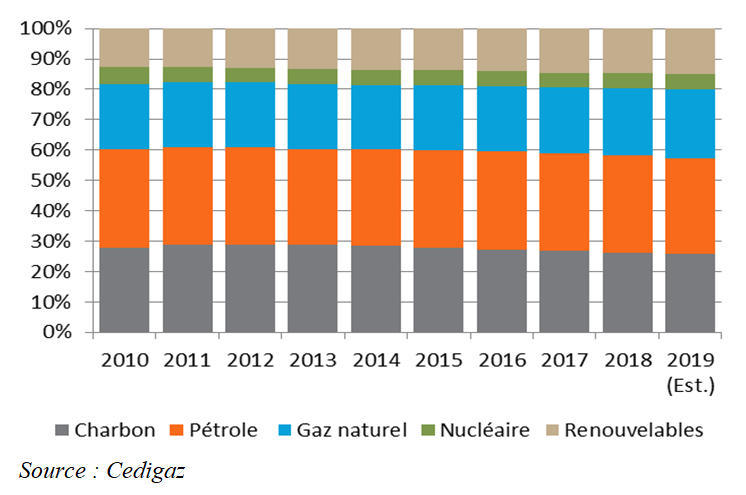
The growth in natural gas consumption has accelerated since 2017. According to the first figures available to Cedigaz, the demand for natural gas continued to display strong growth in 2019 (+ 2-2.5%) to the detriment of coal. As a result, the share of gas in the energy mix continues to rise (Fig. 1). Today, this share is estimated to be 23%, compared to 21% in 2010.
Natural gas consumption in the USA is likely to show an increase of 3.5% in 2019 according to forecasts provided by Cedigaz. However, while significant, the rise is less spectacular than that seen in 2018 (+ 11%), a year in which consumption surged across all sectors. In 2019, the growth in natural gas relates to the electricity production sector due to the still highly competitive natural gas prices ($2-2.5 MBtu), encouraging the use of gas rather than coal. Gas consumption in the electricity sector was thus at a record high in 2019, in parallel with the increase in gas for electricity capacities. The share of gas in electricity production increased from 31% in 2017 to 37% in 2019, while the share of coal decreased very significantly from 31% to 25%.
Since 2017, the USA has been producing more gas than it consumes. Production continued to increase in 2019 at a much faster rate than consumption, thereby creating a surplus destined for export. Gas production reached record levels in 2019, rising by 10% driven by shale gas. Moreover, the commissioning of new gas pipelines, in the Permian basin where the prices of associated gases are particularly low, supported this sustained production. As a result of these developments, exports from the USA, fueled by the demand for LNG, also reached record levels in 2019. It is estimated that the American market was responsible for two-thirds of the global growth in the supply of natural gas in 2019.
In Europe, the demand for gas is estimated to have risen by 3% in 2019, also due to the growing use of gas for electricity production. This can be explained, firstly, by the coal à gas transfer in mainland Europe under the combined effect of low gas prices and an increase in the price of CO2 and, secondly, by weather conditions reducing the availability of renewables, such as hydroelectricity in Spain and Italy. The increasingly variable nature of our weather is having a major impact on the use of gas and renewables, energies that are both competing and complementary. As a result, there is a growing need for flexibility to adapt natural gas supply to demand.
In China, the growth in gas demand slowed in 2019 and is provisionally estimated to be 9% (2018: +17%). This is against a background of a slowdown in economic growth and trade tensions with the USA. Moreover, the Chinese government relaxed its coal-to-gas switching policy for economic and social reasons. Renewable energies, which have become more profitable than natural gas, increased considerably in the energy mix. The demand for gas is once again expected to rise by 9% in 2020, a lower increase than the objective fixed in the five-year plan.
2019, a remarkable year for LNG
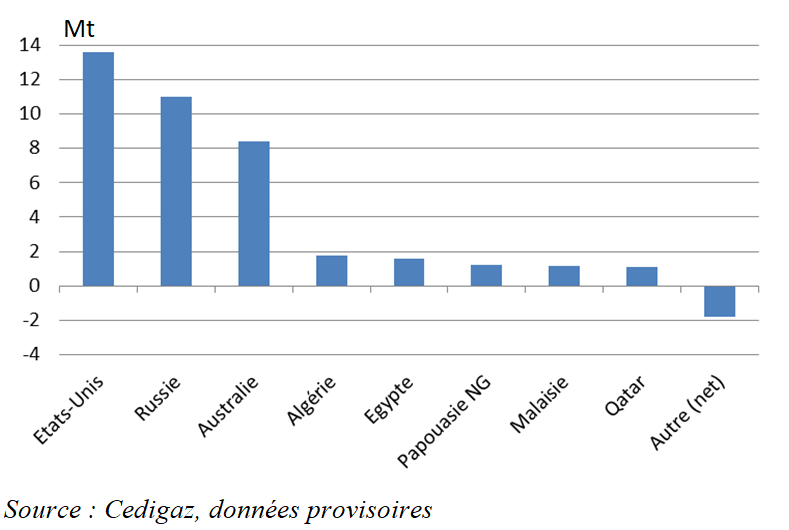
In 2019, LNG supply rose spectacularly at a pace close to the previous record seen in 2010 in terms of volume (+ 38Mt). This can be explained by the surge in export from three suppliers: the USA, Russia (the Yamal project) and Australia (Fig. 2). In 2019, Russia and the USA significantly increased their LNG exports, accounting for nearly two-thirds of the global rise, while diversifying their destinations and bringing liquidity and flexibility to the LNG market. The “commodification” of LNG has increased rapidly with the expansion of spot transactions. The share of LNG in gas supply rose from 10% in 2017 to 11% in 2018 and 12% in 2019.
In terms of demand, there was a significant slowdown in growth in Asia. LNG imports from China grew more slowly than in 2018 due to slowing growth in local gas demand. LNG imports from Japan and South Korea fell sharply due to competition from the renewables and nuclear sectors.
The weakness of Asian demand combined with the arrival of a massive supply of LNG resulted in a surplus of LNG on the markets, a surplus that found buyers in Europe, thereby creating a market of last resort in 2019. It is for this reason that the EU’s imports of LNG almost doubled in 2019. In September, LNG became the EU’s second source of imports behind gas delivered by pipelines from Russia. Via its Yamal LNG plant, Russia was the biggest contributor to the growth in European LNG imports and is now the second largest LNG supplier behind Qatar. Russian LNG benefits from highly competitive supply costs vis-à-vis other LNG supplier countries. As a result, Russia has reinforced its dominant position on the European market to the detriment of other suppliers thanks to LNG as well as sales via gas pipelines, which increased in 2019 through auctions, and Gazprom’s direct sales on the spot market.
The international market is highly likely to remain in surplus over the period 2020-2021, during which the USA will considerably increase its supply of LNG to destinations that are flexible. It is in this context that competition between the major gas suppliers, led by Russia and the USA, will be reinforced. Russia, the world’s leading exporter, is increasing its LNG and pipeline export capacities. The recent development of the Russian gas sector is unprecedented in the history of the oil and gas industry. In a few months, Russia is set to increase its export capacity via pipelines by 109 billion m3/year thanks to the opening up of three new independent routes through transit countries: Power of Siberia (to China), TurkStream and Nord Stream 2 (to Europe). In December 2019 the Power of Siberia gas pipeline was commissioned, marking a turning point in Russian policy concerning the diversification of export routes. Recently, Bulgaria announced it would be importing natural gas via the TurkStream pipeline from 1 January 2020. Nord Stream 2 is also set to be commissioned this year.
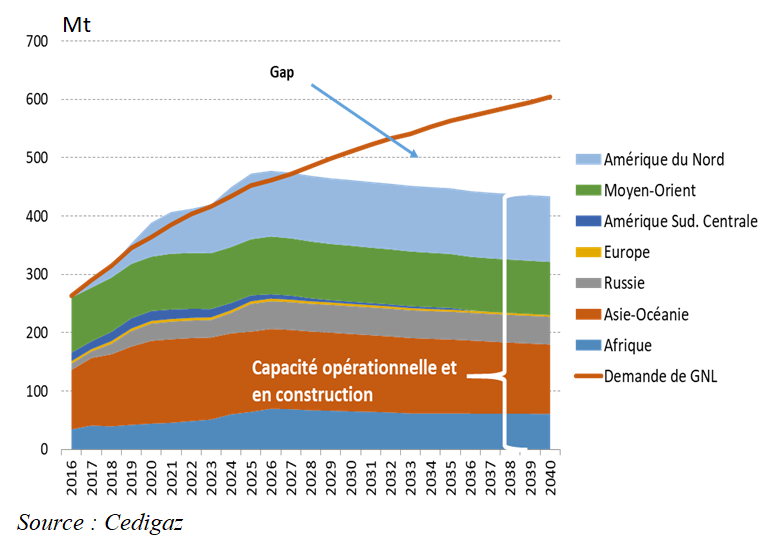
2019 was a record year for investments in liquefaction projects. In total, final investment decisions were made concerning 70 Mt of liquefaction capacities. Moreover, in November 2019, Qatar announced its expansion project aimed at increasing LNG export capacity from 77 Mtpa today to 110 Mtpa in 2024 and 126 Mtpa by 2027. The rebound in investments in 2019 should ensure an adequate supply, or even a surplus, from 2024-2025. According to Cedigaz, LNG will continue to see significant growth and by the end of the 2020s it will be the leading mode of natural gas transport over long distances, ahead of transport via gas pipelines.
Decoupling between market prices and indexed prices
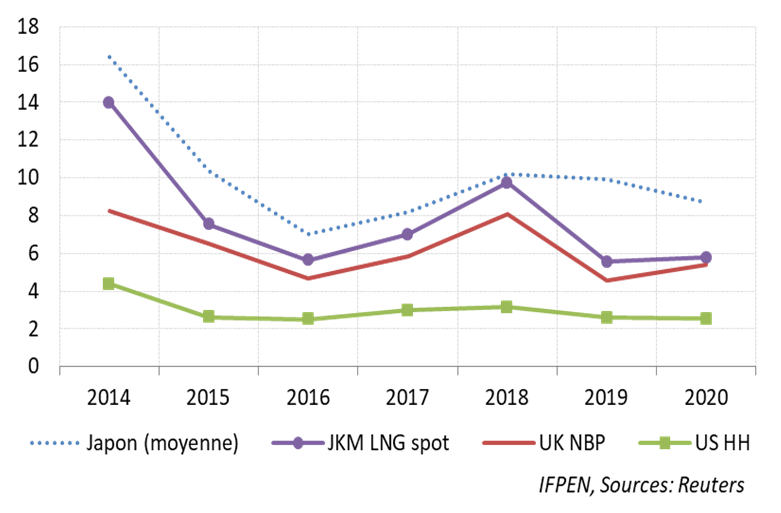
In 2019, spot prices on the Asian and European markets plunged by more than 40% compared to 2018. In September, in mainland Europe, the TTF price fell to a ten-year low, i.e., $3/MMBtu. As for the price of oil, it fell less sharply (- 10%) in 2019. The weakness in spot prices reflects the increasing abundance of LNG supply while the oil price had less of an influence, leading to a decoupling between spot prices and indexed prices in Europe and Asia.
With a surplus in the LNG market since October 2018, the variable costs of American LNG now determine a floor price below which the suspension of American exports is justified. While the supply of LNG will continue to increase, market prices are expected to remain low over the next two years, assuming an absence of weather-related disturbances or major geopolitical tensions. Russian-Ukrainian agreements relating to the transit of Russian gas via Ukraine and the withdrawal from all arbitration proceedings where final decisions had not been rendered were signed on 30 December.
Environmental challenges facing the gas industry
Since gas is associated with lower emissions of CO2 and other pollutants (NOx, SOx, etc.) than other fossil energies, substituting it for coal leads to a significant reduction in emissions. According to the IEA (WEO 2019), the substitution of gas for coal, particularly in China and the USA, led to a reduction in CO2 emissions of 500 Mt over the period 2010-2018.
At a time when pressure to reduce greenhouse gas emissions is intensifying, natural gas is nevertheless increasingly criticized by NGOs and, now, by investors. In November 2019, the European Investment Bank (EIB) decided to stop funding projects linked to fossil fuels, including gas, from 2021.
On 11 December 2019, the new president of the European Commission, Ursula von der Leyen, unveiled the broad lines of the plan to achieve carbon neutrality. This climate road map, known as the Green Deal, is aimed at achieving carbon neutrality by 2050. Hence, the future of natural gas in Europe depends, on the one hand, on its decarbonization, and, on the other hand, on the industry’s capacity to remove methane emissions associated with its production and transport.
Increasing the development of renewable gas
The development of renewable gas represents one of the essential levers for gas decarbonization.
Methanization (biogas production) is now the leading mature renewable gas production technology. Other processes, incorporating hydrogen production, are being developed and represent additional tools for reducing the carbon footprint of gas usages. Power-to-gas technology makes it possible to produce hydrogen via water electrolysis from renewable electricity and to use it, either by direct injection into the network, or after conversion into synthetic methane via methanation. This technology is at the demonstration stage (electroyzers are already at the commercial stage). Hydrogen can also be produced via the gasification of biomass, or by biomethane or natural gas reforming with CO2 capture.
The renewable gas consumed today is primarily biomethane from biogas. Biogas is obtained via anaerobic fermentation using four types of inputs: energy crops, agricultural waste, solid urban waste (household or industrial) and water treatment plant sludge (PSPP).
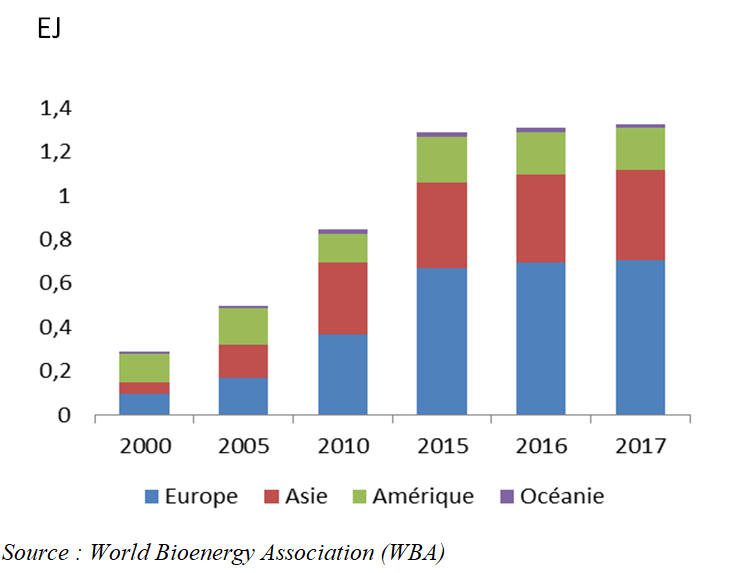
Biogas production was estimated to be around 1.3 EJ, i.e., 34 billion m3 (methane equivalent) in 20171, representing barely 1% of the total gas consumed globally and only 6% of the technical recoverable potential. More than half of this production is concentrated in Europe (Fig. 5), the remainder being in Asia and the USA. On a national level, China (8 billion m3) and Germany (9 billion m3) are the two biggest producers.
In Europe, energy crops make up the bulk of inputs (45%), followed by agricultural waste (33%). In China, agricultural waste accounts for two-thirds of biogas production, with urban waste making up the rest. In the USA, most biogas is generated from landfills.
The majority of the biogas produced around the world is used to generate electricity and heat. The percentage of biogas that is purified and converted into methane is low: barely 8% of biogas is treated and injected into gas networks and a marginal share is used in the transport sector (bio-NGV). The costs of the electricity produced from biogas are high and biomethane is gradually paving the way for new biogas applications.
Currently, global biomethane production capacity is marginal but increasing fast, with growth estimated to be 13%/year (Fig. 6). It was around 5 billion m3 in 2019, i.e., a share of just 0.2% of global natural gas consumption.
The evolution and maturity of the sector are very heterogeneous around the world. Production is concentrated in Europe, North America and, to a lesser extent, China. According to the Benchmark of Biomethane in Europe published by the FranceBiométhane observatory, there were 621 biomethane units in the major European countries at the end of 2018, with a total capacity of 22 TWh of biomethane annually (2 billion m3). This represented a 6% increase over the previous year. The biggest increase in biogas purification capacity was in France (+ 0.5 TWh). In 2018, French plants exceeded the symbolic 1 TWh of maximum annual injection capacity. In total, at the end of 2018, the equivalent of 14 TWh of projects was reserved in the injection capacity management register, i.e., nearly twice the objective set out in the French long-term energy plan (PPE) for 2023 in terms of the quantity of biomethane to be injected into the network. The biomethane sector is required to adhere to a cost trajectory to be defined for the period to 2030. This trajectory is still the subject of discussions between the sector and the French government. A call for bids system has been put in place to encourage producers to reduce their costs and become less reliant on support mechanisms. The French biomethane sector has already identified the priority levers that need to be activated to make it more competitive.
The biomethane sector’s long-term growth potential is considerable in Europe. The production potential is estimated to be around 100 billion m3 according to a number of studies carried out2.
On a global scale, around three-quarters of the biomethane produced is injected into the networks, with the remainder used for vehicle fuel. This reflects the importance of the mature markets of Europe and North America, which dominate the sector. In Europe, almost all biomethane is injected into the networks, with the exception of Scandinavia where the network remains underdeveloped and biomethane is used as bio-NGV. The share of bio-NGV in total NGV consumption is estimated to be 20% in Sweden, 10% in Norway and 5% in Germany but it is marginal in the rest of Europe. However, several countries are keen to stimulate bio-NGV demand by imposing quotas on biofuels combined with the issue of guarantees of origin. Such is the case, for example, for the UK and Italy, the European NGV champion.
In the USA, the demand for biomethane is accelerating rapidly, supported by incentive regulations promoting sustainable mobility and large-scale investments in the sector. Biomethane plant capacity rose from 0.8 billion m3 in 2018 to 1.4 billion m3 in 2019. The technical and economic production potential is estimated to be 57-71 billion m3/year.
However, the greatest potential for biogas and biomethane development lies in the emerging markets of Asia, particularly China and India, where biomethane is used as a fuel. In February 2019, China’s national energy administration published draft guidelines relating to biomethane production objectives: 2 billion m3 in 2020, 15 billion m3 in 2025 and 30 billion m3 in 2030. Like China, India is supporting the development of bio-NGV, the potential of which is estimated by the government to be 87 billion m3/year. At present, India only has 17 bio-NGV plants, with a total capacity of 25 million m3/year (source: Renewable Watch Research) but the stated objectives are ambitious. The SATAT (Sustainable Alternative Towards Affordable Transportation) initiative, adopted in October 2018, sets out plans to establish 5,000 bio-NGV plants with a total capacity of 21 billion m3/year by 2025.

Overcoming the challenge of methane emissions
Methane emissions from natural gas have become a major and urgent challenge for the energy industry. Methane, the main constituent of natural gas, has a much greater warming potential than that of CO2 (28-36-fold over a 100-year period) although its lifespan in the atmosphere is shorter (10 years). It is for this reason that scientists estimate that around one quarter of global warming is due to methane emissions caused by human activities (anthropogenic). These are likely to be 9.4 Gt CO2eq in 2020 according to forecasts provided by the U.S. Environmental Protection Agency3. Oil and gas activities and enteric fermentation in ruminant animals are the two leading sources of methane emissions, accounting for more than half of the total.
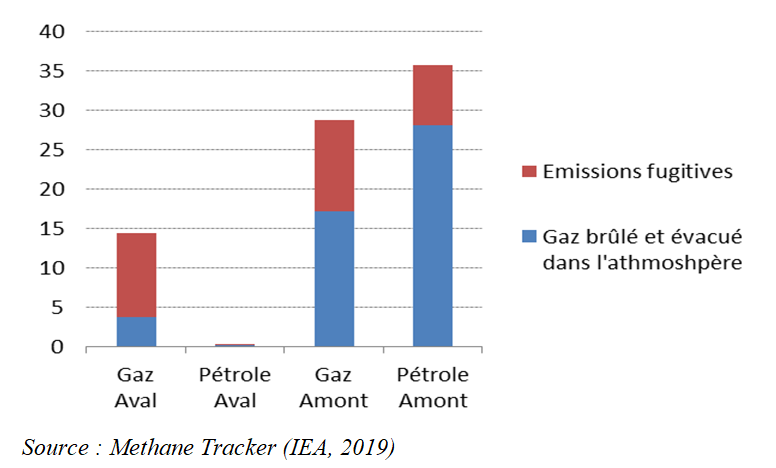
Global methane emissions associated with oil and gas production were estimated to amount to some 80 Mt in 2018 (2.4 Gt CO2eq) by the IEA, representing 6% of the energy sector’s global greenhouse gas emissions. These emissions fall into three categories: fugitive emissions (leaks), said to represent 35% of total emissions, degassing (deliberate removal, often for safety reasons) and flaring. Exploration-production activities emit more methane than any other (Fig. 7). Methane emissions associated with natural gas are estimated to be 43 Mt, i.e., 1.7% of the gas produced. Russia and the USA are responsible for more than 35% of the natural gas sector’s total methane emissions.
The oil and gas sector and governments have already recognized the problem and started to act. In October 2018, the Oil and Gas Climate Initiative (OGCI), bringing together oil and gas companies, defined a target aimed at limiting collective methane emissions. The objective is to reduce the average methane intensity of aggregated upstream gas and oil operations from 0.32% to 0.25% by 2025, which amounts to reducing collective methane emissions by 350,000 t /year.
Several other initiatives exist to reduce methane emissions generated by the oil and gas sector or encourage the recovery and use of the methane emitted, such as the Methane Guiding Principles (MGP), a group created at the end of 2017, the Oil & Gas Methane Partnership, developed by the Climate and Clean Air Coalition, the global methane initiative (GMI), an international public-private partnership and the Global Methane Alliance. Global Methane Alliance member countries will be able, depending on their effective methane emissions and the level of development of their oil and gas sector, to commit to absolute methane reduction objectives of at least 45% by 2025 and 60 to 75% by 2030, i.e., an emissions objective of close to zero. The OGCI has integrated the Global Methane Alliance, alongside the United Nations and the Environmental Defense Fund (EDF), which aims to work with gas producing countries to include the reduction of methane emissions from oil and gas activities in the calculation of their nationally determined contributions.
These objectives are not deemed to be unrealistic insofar as the required technology and funding are available, particularly for the recovery and use of the gas removed or the reduction of long-distance pipeline leaks. Innovation also has a key role to play to speed up emission reduction.
Many uncertainties remain and data is either lacking or unreliable concerning methane emissions, particularly in countries that are high emitters, such as Russia and the USA, where regulations are not as strict as those in Europe.
In the USA, the U.S. Environmental Protection Agency (EPA) estimated total methane emissions generated by the oil and gas sector to be 203 Mt CO2eq or around 8 Mt in 2017, i.e. 31% of total methane emissions. More than 80% are specifically related to natural g of which 52% due to upstream production activities. The agency had estimated that methane emissions represented 1.4% of national natural gas production. More recently, the EDF estimated methane emissions from oil and gas activities to be 13 Mt, i.e., 60% higher than the EPA’s estimate, corresponding to 2.3% of gas produced. Several States in the USA have continued to develop regulations targeting methane emissions despite the federal decision to relax rules governing methane leaks.
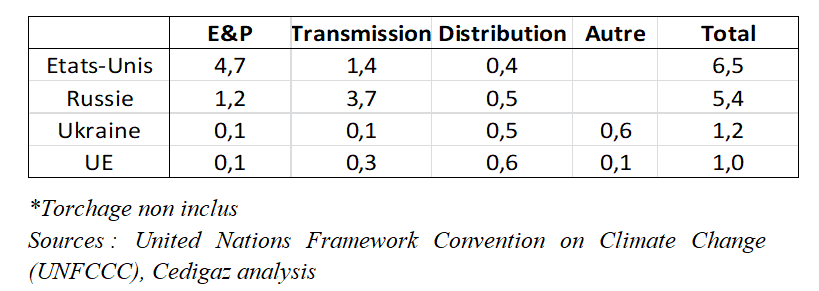
In Europe, EU countries are required to monitor their methane emissions within the framework of the greenhouse gas monitoring mechanism. Methane emissions have been estimated to be 457 Mt CO2eq,responsible for 11% of the EU’s total greenhouse gas emissions. More specifically, methane emissions from the gas industry represent 6% of total methane emissions or 0.6% of greenhouse gas emissions. Contrary to the global average, it is the downstream sector, particularly distribution, that generates the largest share of the region’s emissions (Tab. 1).
The European Commission is working on a highly original methane strategy within the framework of its reinforced plan to tackle greenhouse gas emissions. Methane emissions are particularly targeted within the context of the new European gas package currently being prepared. Although Europe’s contribution to methane emissions is low, it could play a key role in the development of international regulations and methane emission control. The EU imports 80% of the gas it consumes, which equates to almost half of global gas trade, with much of the gas sourced in high-emission countries.
Conclusion
The growth of natural gas in the energy and electricity mix remains strong, driven by environmental and economic advantages. As a low-carbon or zero-carbon source (renewable gas), natural gas has an important role to play from a low-carbon energy perspective. But major challenges remain, particularly the eradication of methane emissions, to enable natural gas to fulfill its potential in a future of low greenhouse gas emissions.
Script submitted in February 2020
(1) Sources : Cedigaz, Eurostat, WBA, AIE
(2) Gas for Climate (Navigant, 2019) ; Ecofys (2018)
(3) Global Anthropogenic Emissions of Non-CO2 Greenhouse Gases : 1990 – 2030 report, US EPA (Dec. 2012)