Plastics recycling is both a major environmental challenge and an emerging industrial sector for which IFPEN mobilizes its expertise and know-how in the field of hydrocarbon refining. From the point of view of recyclability, a significant feature of these new material flows is their high level of variability, both in terms of their composition (types of polymers, additives, mixed textiles, etc.) and their physical nature (multilayer plastics, reverse side/right side fabrics, etc.), and indeed sorting errors. It is therefore essential to develop continuous analyses in order to determine the quality of the flow to to be processed, based on the relevant properties of the materials contained.
Just as sorting centers use Near Infrared Spectrometry (NIR) to categorize plastics on the basis of broad chemical families, we are exploring the use of HSI (Hyper-Spectral Imaging) data to obtain an even more detailed characterization of materials and their heterogeneity, down to a quantitative chemical composition if possible [1].
Consequently, IFPEN has access to an (Specim SWIR) HSI camera installed on the AXEL’ONE platform. This rapid analysis technology, known as “push broom”1, makes it possible to obtain a complete spectral signature for each pixel of the zone analyzed. Unlike a standard color image made up of three wavelengths (RGB: Red-Green-Blue), the spectrum obtained here covers 288 wavelengths, ranging from 1,000 to 2,500 nm (10,000 to 4,000 cm⁻¹). This spectral range contains a wealth of information concerning the chemical nature of the molecular bonds within the materials analyzed. These “spectral fingerprints” can then be used for two forms of chemometric processing (multivariate analysis):
- Unsupervised : by Principal Component Analysis (PCA), to identify the principal sources of variability in the database acquired and visualize their distribution.
- Supervised for the purposes of obtaining
- The classification of objects or pixels (via PLSDA2).
- The quantitative prediction of the composition or of a property (via PLS3).
- The classification of objects or pixels (via PLSDA2).
The use of these 3D data4 begins with an image segmentation phase to locate the objects present. Only pixels of interest are conserved and analyzed. Spectral data are then pre-processed to minimize the impact of physical parameters (sample height, surface condition, orientation, shading, etc.) that may alter the spectrum and mask chemical information.
1 With a moving scanner line like a photocopier
2 Partial Least-Square Discriminant Analysis: algorithm used simultaneously as a dimensionality-reduction and a classification tool (variant of PLS)
3 Partial Least-Square: empirical modeling algorithm based on statistical analysis that finds, for a sample base, the correlations between a descriptor matrix X and a property vector Y. The latent variables of the model are calculated by maximizing the co-variance between X and Y.
4 3D: 2 spatial dimensions and 1 spectral dimension (pseudo-absorbance data)
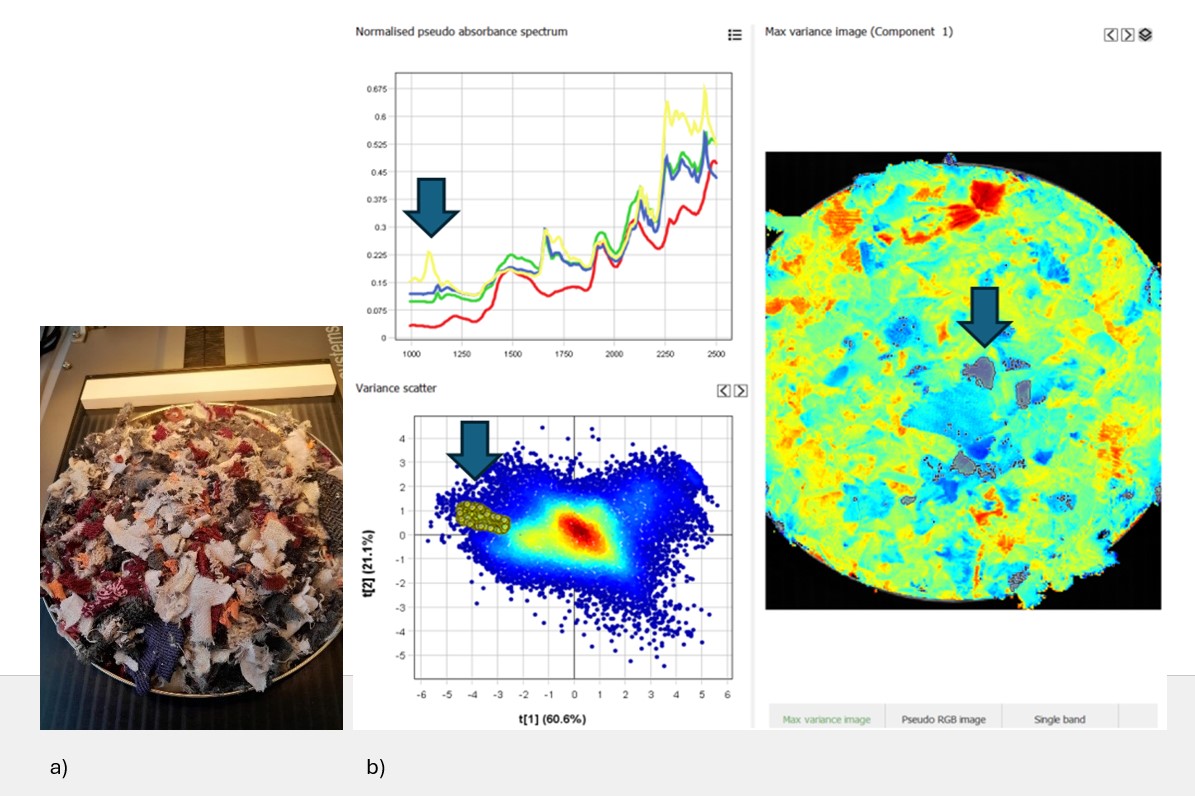
This is followed by the actual analysis, illustrated in Figure 1 for a mixture of shredded textile consisting of 50% polyester and 50% natural fibers (Figure 1.a).

a) Example of a sample of shredded textile positioned under the camera on a small benchtop conveyor.
b) Visuals of the operating software after pre-processing and PCA analysis.
On the right of Figure 1b, the false colors used to represent the first principal component of the PCA, after data normalization5, highlight the heterogeneity of the sample's chemical composition. Here, the blue pixels are characteristic of polyester while the reddest pixels correspond to higher cotton concentrations.
5 SNV (Standard Normal Variate) normalization: each spectrum has its mean subtracted from it and the result is then divided by its standard deviation.
The spectra shown in the top left of the same figure clearly demonstrate the diversity of spectral signatures depending on fragment composition. Since this signature is characteristic of the material (cotton, polyester, polyamide, etc., pure or mixed), the signal can be used to determine the overall composition of the textile load, taking into account its heterogeneity.
In the bottom left-hand corner of Figure 1b, the score plots represents PCA components 1 and 2, where the colors indicate pixel density. For example, the yellow spectrum corresponds to the pixels highlighted in yellow in the score plot and located on the right, at the level of the grey-shaded fabric fragments (follow the arrows!).
This way of working should make it possible to characterize polymer flows in the form of granules, flakes or textiles. To this end, we are gradually enhancing our database with reference materials, with a view to building high-performance quantitative models.
The characterization of black polymers (loaded with carbon black) is one of the main limitations of this technique, as no usable signal can be recovered. To overcome this constraint, specific research is underway using 2D fluorescence spectrometry on these materials [2]..
References:
- Paz, M.L.; Sousa, C. Discrimination and Quantification of Cotton and Polyester Textile Samples Using Near-Infrared and Mid-Infrared Spectroscopies. Molecules 2024, 29, 3667.
>> DOI : https://doi.org/10.3390/molecules29153667
- Gruber, F.; Grählert, W.; Wollmann, P.; Kaskel, S. Classification of Black Plastics Waste Using Fluorescence Imaging and Machine Learning. Recycling 2019, 4, 40.
>> DOI : https://doi.org/10.3390/recycling4040040
Scientific contact: Noémie Caillol


