02.03.2020
30 minutes of reading


Oil prices, having soared to over $70/b at the start of 2019, fell back after May to levels of between 60 and $65/b. They briefly climbed back to the $70/b mark at the end of the year on the back of geopolitical tensions (Fig. 1). Since mid-January, the oil price has remained below $60/b due to the potential impacts of the coronavirus on world economic growth. Setting aside this new context, the evolutions seen in 2019 primarily reflect the significant influence, deliberate or otherwise, of the USA. This influence manifested itself in three ways: firstly, the trade war between the USA and China, a source of financial instability (Fig. 2) and economic uncertainties; secondly, geopolitical tensions with Iran and Venezuela in particular; and thirdly, question marks surrounding the development potential of tight oil (or shale oil). In December 2019, OPEC+, i.e., an alliance of OPEC and 10 producing countries including Russia, adapted its oil strategy to this uncertain context. All of these parameters combined serve to reinforce the lack of market visibility, a situation that is, in reality, fairly standard for the sector.
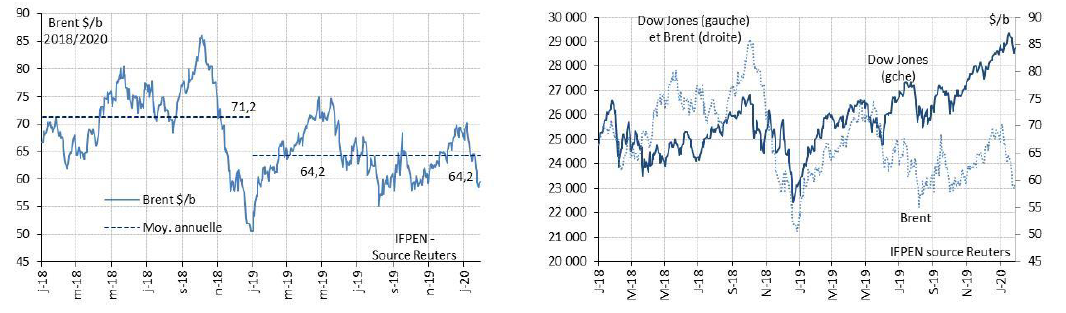
Fig. 2: Dow Jones and Brent prices 2018 to 2020
Global economic slowdown or recession imminent?
Concerns about the level of global economic growth were regularly expressed throughout 2019 with the underlying fear of a possible recession. At the 40th meeting of the IMF’s International Monetary and Financial Committee held last October, the institution reiterated that global economic growth in 2019, now estimated to be 2.9% (Fig. 3), had fallen continuously throughout the year.
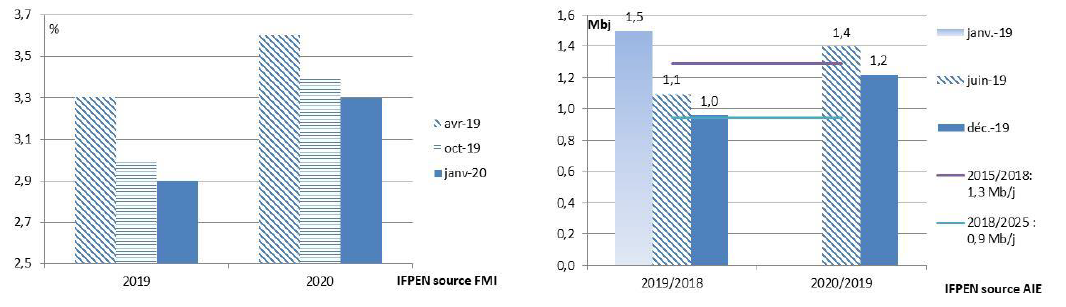
Fig. 4: Global annual demand for oil (revised figures from January 2019 onwards) in 2019 and 2020
While sustained growth is expected for 2020 (3.3%; Fig. 3), at the beginning of the year, both the IMF and the World Bank emphasized the fact that the outlook is unclear: trade tensions, political uncertainty and geopolitical risks, as well as the consequences - temporary or otherwise - of the coronavirus on economic growth mean that the potential for a downturn is considerable. The context is considered fragile, characterized by limited flexibility, high and increasing debt levels and a significant degree of financial vulnerability. Despite this, the start of the year ended on a positive note with the signing of a “preliminary deal” between the USA and China. The deal brings an end to escalating tensions but it is too soon to state that the trade war initiated more than two years ago is definitively behind us.
Beyond the jolts in the financial markets with their inevitable impacts on oil prices, the consequences of a slowdown in economic growth for the oil market are more tangible, i.e., the growth in the demand for oil does not increase as fast. Estimated to be 1.5 Mb/d for 2019, this growth is now around 1 Mb/d (Fig. 4), which is below the average seen over the last five years (+ 1.3 Mb/d excluding biofuels). This significant adjustment seen throughout the year is one of the factors behind falling oil prices after May 2019.
For 2020, growth is estimated to be 0.8 Mb/d1, still well below the average of the past five years. If this forecast proves accurate, it may mitigate potential pressure forcing prices up this year, provided there are no disruptions to oil supply.
Potential impact of the coronavirus on the oil market
On 30 January, it is obviously still too soon to be able to judge the scale and duration of the impacts on global economic growth of the health crisis associated with the coronavirus. Previous health crises - SARS in 2003 and H1N1 in 2009 - had marked impacts, particularly on aviation, but they were of limited duration (between one and three months). Moreover, it is difficult to draw comparisons because other events occurred during these periods: the second Gulf War, with its consequences for oil prices between 2002 and 2003, and the economic crisis of 2008.
The recent reaction of the financial and oil markets highlights real concerns relating to economic growth reflected in marked falls on 27 and 30 January. The price of Brent, already falling after 6 January with the easing of geopolitical tensions, dropped below the $60/b on 24 January and has been hovering at between 58 and $59/b ever since.
From an oil market point of view, there are two potential consequences.
The first concerns China in terms of economic growth and oil demand due to the confinement of some of the population. The country consumes around 14 Mb/d and imports some 10 Mb/d, i.e., 10% of global oil demand. A fall in consumption would have a significant impact, especially since the global market is in surplus in the 1st half-year.
The second consequence concerns international travel. For each crisis of this type, there has been a temporary but significant fall (7%/15% over a period of 1 to 3 months) in air traffic, a sector that consumes around 7.6 Mb/d of oil products. To give an idea of the scale of the impact, a 10% fall in air traffic over a period of between 2 and 4 months would lead to a decrease in consumption of between 0.1 and 0.3 Mb/d.
Should the crisis last, and given the market surplus of the 1st half-year, the price could settle below its equilibrium price range ($60 to $70/b), at levels low enough to re-balance the market, ensuring a cut in supply and a recovery in demand. As of 30 January 2020, this scenario remains highly uncertain.
Activities related to shale oil in decline: sign of management or of crisis?
The first potential upheaval may come from American production. The fall in drilling activities in the USA since October 2018 has raised questions about the slowdown, to a greater or lesser degree, in future production growth.
The EIA predicts a slowdown in this growth from 2020, but this slowdown needs to be qualified. The outlook published by the EIA in January still reckons on a fairly marked increase in American production in 2020 of about 1.5 Mb/d (1 Mb/d for oil and 0.5 Mb/d for NGLs – Fig. 5). While these actually represent a slowdown compared to the evolutions observed in 2019 and 2018 (1.8 and 2.2 Mb/d respectively), this increase, above the expected rise in global demand next year (0.8 Mb/d), would be enough to lead to an oil surplus in the first half-year of 2020 at least.
Hence these EIA data do not suggest an impending crisis in the sector. Nevertheless the context remains fragile, with a still significant number of bankruptcies (around 30 in 2018 and 2019 for producers), though fewer than those seen in 2015 and 2016 (44 and 70 respectively). Furthermore, the long-term outlook, according to data published by the IEA and OPEC at the end of 2019, does not indicate an end to the development of shale oil in the USA. In fact, both organizations forecast relatively significant increases, until 2025 for OPEC (+ 7 Mb/d) and until 2035 for the IEA (+ 5 Mb/d).
However, a question remains concerning the reality of these increases due to the uncertainties surrounding the outlook for the Permian Basin and the fact that some investors are keen to reduce their shale oil investments in order to improve their financial results. A deliberate reduction in activity would result in a drop in supply, which is highly dependent on the number of drilling operations.
By way of illustration, if drilling operations were to stop suddenly - an as yet fictitious scenario - there would be a very rapid reduction in American production (Fig. 6). This demonstrates that, contrary to what has been said in the past, old drilling operations make a relatively limited contribution to total production due to the rapid decline in the production of this type of well.
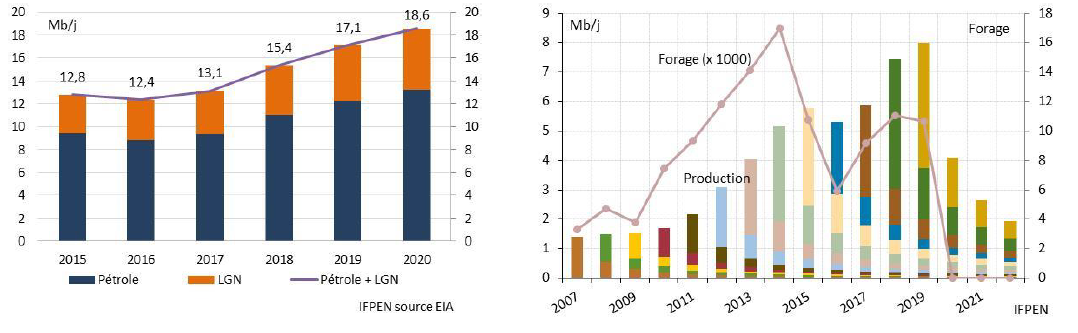
Fig. 6: American shale oil production in a fictitious scenario of the suspension of drilling operations after 2020 (2007 to 2022)
This should be qualified though by saying that the increase in productivity makes it possible to produce more with fewer wells. To realize this, we just need to look at what has happened for gas: the number of drilling operations has fallen by more than a third since 2010 while production has increased by a factor of 1.6 (Fig. 7) over the same period. The oil sector has evolved in a similar fashion since 2014: the number of drilling operations has halved while production has increased by a factor of 1.5 (Fig. 8).
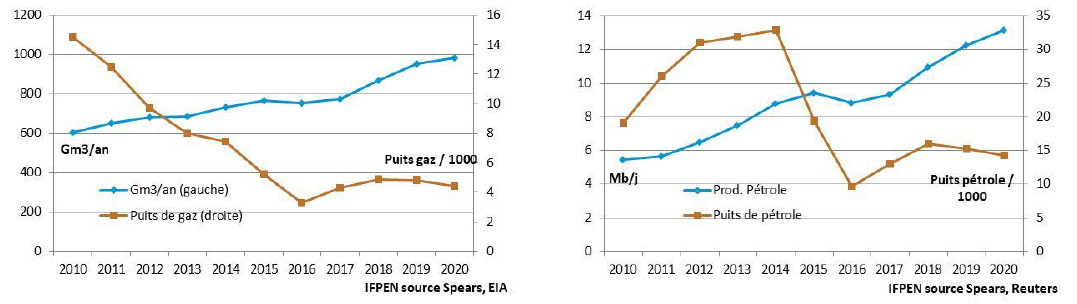
Fig. 8: Oil production and number of drilling operations in the USA (2010 to 2020)
These data relating to drilling activity and productivity, which have opposite effects on the level of production, should encourage a degree of caution when it comes to forecasts and repeated announcements regarding oil production “bubbles” and decline… Assuming the number of drilling operations remains stable after 2019 (11,000 horizontal wells) and productivity per well remains stable, IFPEN’s model suggests production will stagnate in 2020 (Fig. 8). Assuming a drop in productivity or a reduction in the number of drilling wells, production may even fall back slightly.
The various forecasts outlined here do not take into account wells that have been drilled but have yet to be fractured (DUC: drilled but uncompleted), which could be commissioned rapidly. They have already been mobilized, falling from 8,400 in March to 7,500 in November 2019. The commissioning of 1,000 wells equates to a gain of around 0.2 Mb/d in the first year of production.

It would be unwise to decide between the growth scenario (+ 0.9 Mb/d) envisaged by the IEA and possible stagnation in 2020. In any case, this marked difference, which has probably been incorporated by the markets, will be a source of uncertainty as far as market equilibrium is concerned.
Opec+, a new influential player in the oil market
The 13 members of OPEC2 are now actively supported in their supply management strategy implemented since 2016 by 10 further countries. Among these, the most important in terms of production are Russia (11 Mb/d), Kazakhstan and Mexico (1.9 Mb/d each). Brazil, a major producer with an output of 3.1 Mb/d, has indicated its interest in joining the organization, a move that would further reinforce the alliance. Conversely, Ecuador, a country with a modest output (0.5 Mb/d), left the organization in January 2020.
In July 2019, these 23 countries, forming an alliance known unofficially as “OPEC+”, signed a charter of cooperation underlining the commitment to maintaining long-term collaboration, particularly between Saudi Arabia and Russia. This is a strength in that OPEC+ represents around 55% of global oil production. But the move also reflects a weakness linked to the threat of an increase in supply from non-OPEC+ countries (Fig. 9). This increase may be as high as 2 Mb/d on average in 2020, primarily driven by American shale oils (1 Mb/d), but also by expected growth in Norway, Brazil and Guyana. In this context, OPEC+ will adapt its production to avoid market surpluses likely to increase oil stocks, which are currently at a level within the five-year average range.
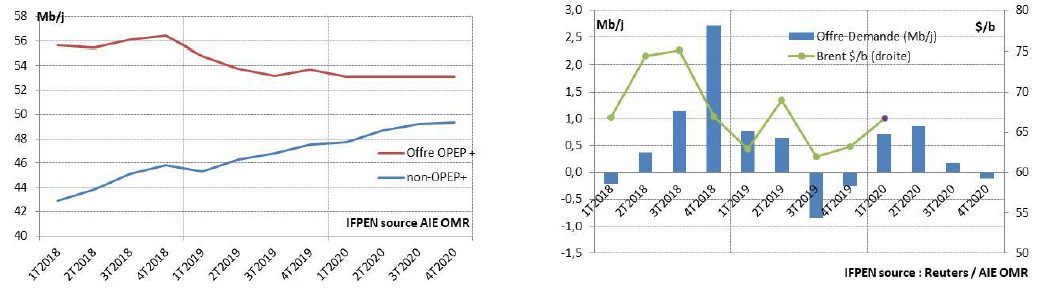
Fig. 10: Difference between global oil supply/demand and Brent prices (2018 to 2020)
This strategy has proved effective so far although a significant surplus did arise in the final quarter of 2018. This contributed to falling oil prices in 2019 but they nevertheless stayed above a $60/b average (Fig. 10). The latest agreement, defined in December 2019 (see annex), is not sufficient to reduce the surpluses expected in the first half of 2020. It may, however, help achieve balance during the second half of the year. However, this will depend on the effect of the coronavirus on the world economy and on the OPEC response expected in early March.
Russia provides significant support to Saudi Arabia
This strategy, that can be qualified as positive for OPEC+ in terms of propping up oil prices, involves four main players: Saudi Arabia, Russia, Iran and Venezuela as well as, indirectly, the USA.
Saudi Arabia acts as a market regulator, respecting the agreements in place but not hesitating to go further and adjust its production based on the context. For example, in mid-2018, the country stepped in to offset falling output in some producing countries and maintain market balance. And at the start of 2019, the country reduced its output to avoid a market surplus. Saudi Arabia thus remains a pivotal player in the oil market with the country’s determination to support and stabilize oil markets likely to be reinforced with the flotation of Saudi Aramco initiated in November 2019. Consequently, the attack launched on its facilities on 14 September caused shock waves. However, the incident only led to a very temporary increase in the price of oil on 16 September given the use of stocks and, more importantly, the rapid steps taken to repair the facilities.
The association with Russia (11 Mb/d) is vital given its position as the world’s 2nd biggest producer behind the USA (12 Mb/d) and ahead of Saudi Arabia (10 Mb/d). This adds real credibility to the decisions taken by OPEC+ when they are “celebrated” by the country. It should be noted, however, that both Russia and Saudi Arabia have very different budget constraints. Russia requires a price of $50/b to balance its budget whereas Saudi Arabia requires a price of $80/b. There is thus more pressure on Saudi Arabia, which may explain the effort made by the country in discussions for the latest OPEC+ agreement (see annex).
American sanctions on Iran and Venezuela are facilitating the supply management policy implemented by “Opec+”
Beyond the concerted action of the alliance’s members, the price support policy is aided by the American embargo applied to Iran since November 2018. These sanctions were reinforced in May 2019 with the end of specific authorizations granted to some importers of Iranian oil, including China and India. Venezuela has also been the target of American sanctions on oil since April 2019, but the drop in production occurred well before this due to the country’s domestic political situation.
In global terms, both countries have seen significant falls in production: 1.6 Mb/d for Iran since July 2018 and 1.8 Mb/d for Venezuela over a four-year period (Fig. 11). The two countries, which are not subject like Libya to the current quota policy, are responsible for half of OPEC’s production decrease observed since the start of 2019, the remainder being the result of the active reduction policy implemented by Saudi Arabia.
Sanctions on Iran and Venezuela’s domestic situation are thus having a significant impact on market equilibrium. The context also facilitates supply management for the 11 OPEC member countries subject to quotas. It is probably the return of Iran to the marketplace that could change everything and potentially create pressure within OPEC+ to define a supply management policy incorporating the increased influence of the country.
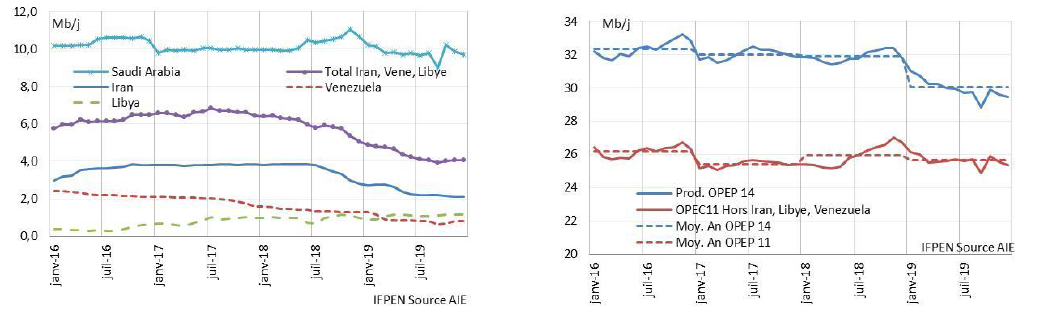
Fig. 12: OPEC’s monthly and annual production with and excluding Iran, Venezuela, Libya - 2016 to 2019
It is, however, highly unlikely that such a change would occur before the American elections at the end of 2020. Beyond, the return of Iran to the marketplace may become necessary, or even vital. The fall in oil sector investments since 2015 (see IFPEN fact sheet: ”Exploration-production investments”) raises fears of a shortfall in supply in the medium term, likely to create price pressures.
This goes back to a broader issue relating to the energy transition. The energy transition involves a decrease in oil consumption, which may give rise to the idea that there is a need to cut oil investments immediately. But that would lead to a risk of market disequilibrium. That is because demand would fall more slowly than the fall in supply due to a lack of investment. In the absence of careful management, an oil crisis cannot be excluded if investments are inadequate or if associated funding is too restricted.
Tensions in the Middle East have only had a limited impact on oil prices
In 2019, two leading oil-producing countries, Saudi Arabia and Iraq, saw their production levels impacted by instability in the Middle East. But falls remained modest and of short duration, bearing no relation to the situation observed in Iran.
From 4.7 Mb/d produced on average in 2017, Iran’s production of oil and natural gas liquids (NGLs) fell back to 3.2 Mb/d in November (3.4 Mb/d on average for 2019 as a whole). This 1.5 Mb/d decrease represents some $34 billion per year, i.e., around 8% of the country’s GDP. It is against this background that Iran has seen a very significant reduction in economic growth (-4.8% in 2018 and -9.5% in 2019) and high inflation (30 and 35% respectively). The impact on oil prices has been very low insofar as the quantities involved have not affected market equilibrium. However, increasing tensions between Iran and the USA between 3 and 8 January 20203 caused the price of Brent to temporarily increase above the $70/b threshold.
For its part, Saudi Arabia, following the attack against the Abqaiq and Khurais facilities on 14 September, saw its production fall, but only very temporarily. It fell from 11.8 Mb/d in August to 10.8 Mb/d in September before climbing back to around 12 Mb/d over the next two months. The rapid repair of the facilities limited the impacts on the price: the sharp rise on 16 September (+$7/b to $68/b) was wiped out over the next two weeks.
The third country to be impacted is, of course, Iraq, at the heart of regional tensions. 80% of the country’s production is concentrated in the south, the remainder coming from the autonomous Kurdistan region (0.5 Mb/d) and from fields located around Kirkuk (0.4 Mb/d) controlled by Baghdad. The country is vital to equilibrium in the global oil market, with production that increased from 3 Mb/d in 2012 to 4 Mb/d in 2015. Today, output is close to 5 Mb/d. Since the start of October, the situation in Iraq has been marked by social and political unrest, sometimes targeting oil facilities, but such action has so far had little impact on oil supplies. In addition to this unrest liable to affect oil production, the country is now under the threat of American sanctions, following the non-binding vote by the Shiite majority in the Baghdad parliament to expel foreign troops.
Diverging price forecasts due to the range of credible scenarios
It is never easy to provide an accurate assessment of the oil market, which explains the often diverging announcements relating to price movements, which depend on a variety of scenarios as explained below.
On the demand side, adjustments in either direction seem to be feasible at the start of 2020 given the uncertain economic and financial context. On the supply side, models based on drilling activity and well productivity do not provide any clear indication as to whether there will be a significant increase or moderate fall in the supply of shale oils.
As far as OPEC+ is concerned, several questions remain for countries exposed to sanctions (Iran) or internal tensions liable to reduce their production. This is particularly the case for Iraq which, with a total output of 4.7 Mb/d, is the biggest producer after Saudi Arabia and Russia. After the presidential election in Algeria on 12 December, the situation remains similarly uncertain in a country that produces modest volumes of oil (1 Mb/d) but more significant volumes of natural gas. This is also the case in Libya, where further tensions are likely after the collapse of the cease-fire that had been agreed in Moscow on 12 January. The country’s oil production, which had bottomed out between 2014 and 2016 at around 0.5 Mb/d, has risen since 2018 to more than 1 Mb/d.
OPEC+ will have to take all these uncertainties into consideration when defining its strategy. This strategy is set to be one of supporting oil markets with a view to balancing budgets. But it is also likely to be one of ensuring market equilibrium in order to avoid excessive price increases. The challenges will be to not favor the main competitors, i.e., American producers, and also to avoid impacting the global economy and hence oil demand. A long-term vision, incorporating the effects of the energy transition on oil consumption, is another probable consideration. Excessively high prices would tend to accelerate the pace of this transition.
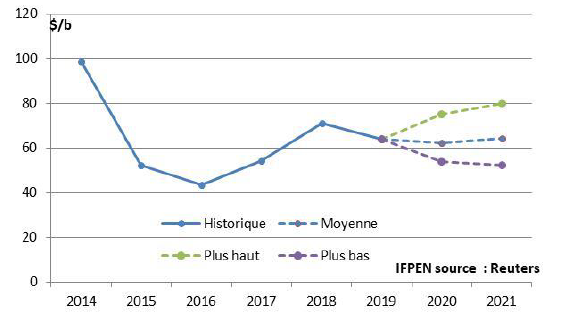
The average annual price of Brent varied between 40 and $100/b from 2014 and has fluctuated between 55 and $65/b since 2017. Price forecasts for 2020 and 2021 suggest levels within the latter range, of between 52 and $80/b4 (Fig. 13). The $64$/b average is equivalent to that of 2019, underlining the traditional influence of the recent past in near-future forecasts. Its seems difficult to decide between these extremes, reflecting a broad range of possible scenarios.
Nevertheless, this average is in line with falling production costs since 2014, explaining the drift away from the $100/b mark, the oil market’s equilibrium price point between 2011 and mid-2014. Recent analyses conducted by Rystad suggest maximum production costs of $70/b, excluding oil sands (70 to $90/b).
A price of between 60 and $70/b is thus consistent with the currently highest production costs ensuring the profitability of associated projects. The broader 50 to $80/b range takes into account economic, financial and geopolitical uncertainties that could cause oil prices to shift away from values in line with production costs.
Annex 1: Relationship between the price of Brent and the price of oil products in France
Prices at the pump are influenced by three parameters:the price of oil, which primarily depends on its supply and demand;
- the euro/dollar exchange rate; the higher the level, the lower the price of oil expressed in €;
- oil product prices on international markets, which are correlated with the price of oil but which may also vary depending on specific tensions;
- The level of taxes including “TICPE” (domestic consumption tax on energy products), frozen since 2019, and VAT.
Figure 14 highlights the impact of the value of the euro. It was in the 1.20 to $1.25 range at the start of 2018, which helped limit price increases at the pump. Since the end of 2018, it has been in the $1.10 to $1.15 range, making prices more susceptible to increases. By way of illustration, for a Brent price of $65/b, the difference in the euro price per liter is around 3 euro cents per liter when the euro is worth between $1.1 and $1.2.
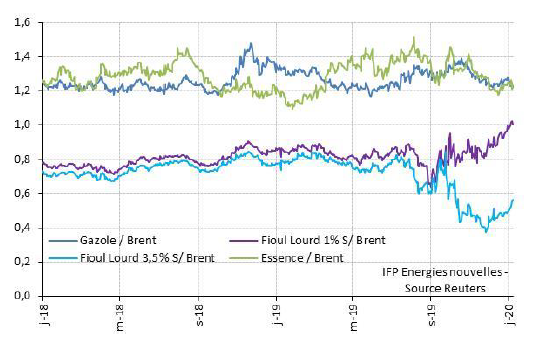
Figure 15 highlights the strong correlation between Brent prices and oil product prices expressed in euros. However, significant differences are observed, reflecting conditions specific to the product market. Such was the case at the end of 2018 due to the low-water crisis on the Rhine hampering oil product trading by barge. This created pressure on diesel while there was a surplus of gasoline, causing the prices of the two products at the pump to move closer together.
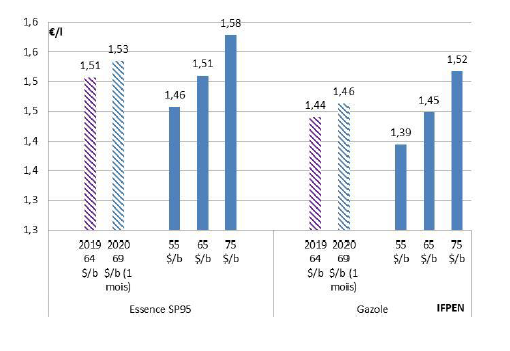
In terms of annual average, prices remained stable in 2019 compared to 2018, at around €1.51/l for E10 gasoline and €1.44/l for diesel for a Brent price of $64/b and a euro worth $.1.12. Assuming variations between 55 and $75/b, all things being equal, product prices would move by around +/- 6 euro cents/l compared to 2019 levels (Fig. 16).
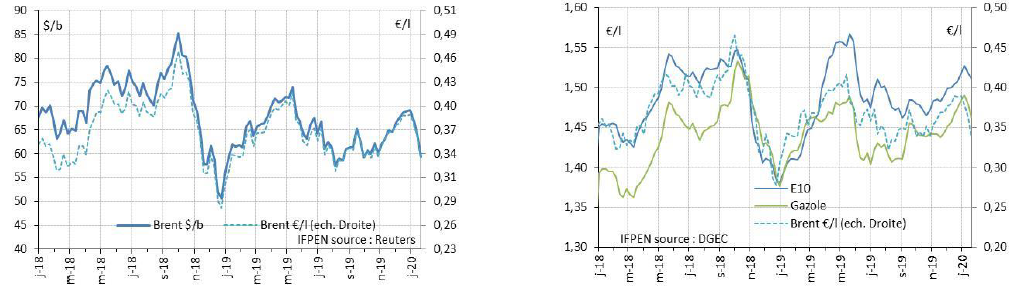
Fig. 15: Brent prices and oil product prices in €/l
Annex II: IMO 2020, standard to limit the sulfur content of marine fuels
International Maritime Organization (IMO) regulations, which specify a maximum sulfur content for fuels used by the global shipping fleet of 0.5%, came into force on 1st January 2020.
Several options exist to comply with the regulations and replace heavy fuels with a high sulfur content: the use of marine diesel oil or marine gas oil (MDO or MGO), the use of a heavy fuel with a 0.5% or 0.1% sulfur content (VLSFO and ULSFO respectively); cleaning exhaust gases on the ship via a scrubber if fuels with a sulfur content in excess of 0.5% are used, the use of alternative fuels such as liquefied natural gas or LNG.
Contrary to original expectations, it appears that adaptations made by the refining sector and ship owners have prevented pressure on the price of oil products, particularly marine diesel (Fig. 17). The most significant effect concerns heavy fuels, with an increase in the price of fuels with a low sulfur content (Heavy fuel 1% on graph 17) and a considerable fall in the price of fuels with a 3.5% sulfur content. This phenomenon may be corrected by the development of new markets for these fuels with a high sulfur content, particularly in Asia’s electricity production sector.
Annex III: The impacts of trade disputes, including the one between China and the USA
In its latest analysis dating back to October 2019, the WTO revised its forecasts for trade growth in 2019 and 2020 downwards due to “escalating trade tensions and a slowing global economy”. World merchandise trade volumes are now expected to “rise by only 1.2% in 2019, substantially slower than the 2.6% growth forecast in April”. The projected increase in 2020 is now “2.7%, down from 3.0% previously”. Economists caution that “downside risks remain high and that the 2020 projection depends on a return to more normal trade relations”.
Hence various disputes and threats to trade cause economic growth and global trade to slow. Numerous analyses focus more specifically on China where growth slowed during the 3rd quarter of 2019. This is a particularly sensitive issue for the oil market insofar as the country was responsible for 28% of the increase in global oil demand in 2017 and 58% in 2019.
Some headlines are particularly alarmist: “growth in the Chinese economy slumped to 6% in the 3rd quarter, the lowest in at least 27 years”. There can be no doubt that the consequences of the trade war are affecting and will continue to affect the Chinese economy. However, it is necessary to qualify these analyses, which are based entirely on evolving growth rates.
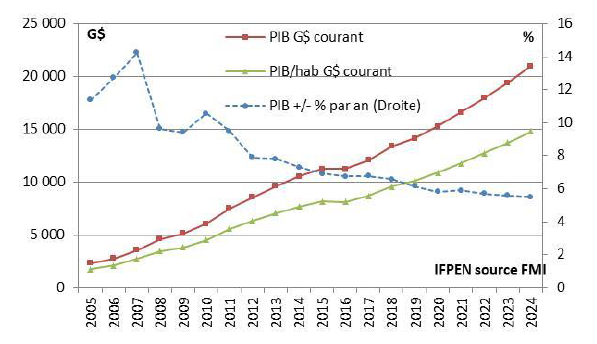
It is important to remember the obvious fact that growth rates fall for linear evolutions. This is clear where China is concerned. Latest IMF statistics reveal a trend decline in the growth rate that is likely to fall below 6% in the next few years. This will, in all probability, generate further alarmist articles on the subject5.
But the issue for China lies elsewhere: actual GDP, especially GDP per capita, which, while being an imperfect indicator, gives some idea of the country’s development. It has seen almost linear growth since 2005, a sign that living standards have been improving all the time. This should lead to an increase in the demand for oil, at least in the short term, before the rise in the share of electric vehicles (150 million in 2040 according to the IEA) and shrinking population (towards 2030) result in stagnation and then decline. An analysis based purely on growth rates is thus too simplistic and ultimately appears to lack relevance.
Annex IV: The OPEC+ agreement reached in December 2019 adjusts quotas to actual supply: -0.5 Mb/d in January 2020, plus a voluntary contribution of - 0.4 Mb/d by Saudi Arabia
The OPEC+ agreement of 6 December provides for an additional cut in production - beyond that agreed in December 2018 - of 0.5 Mb/d for OPEC+ from next January, of which 0.37 Mb/d for OPEC and 0.13 Mb/d for partner countries. 80% of the cuts are being made by five countries, of which Saudi Arabia (33%, 167 kb/d), Russia (14%, 70 kb/d) and UAE, Kuwait and Iraq (around 10%). Compared to October 2018, the benchmark for the previous agreement, this leads to an overall reduction of 1.7 Mb/d, of which 1.2 Mb/d for OPEC and 0.5 Mb/d for OPEC partner countries. An additional voluntary contribution of 0.4 Mb/d by Saudi Arabia takes the decrease compared to October 2018 to 2.1 Mb/d.
The new agreement, in line with actual OPEC+ supply in the 3rd quarter of 2019, “artificially amplifies” the fall in production. This is due to the fact that the benchmark used in terms of production, i.e., October 2018, bears no relation to current levels, either for the 11 OPEC countries subject to quotas, Saudi Arabia or for OPEC’s partner countries.
The forecasts made with respect to market equilibrium in October 2020 took into account the reality of a supply well below that of October 2018. It should also be recalled that Saudi Arabia had alluded to supply being limited to 9.9 Mb/d back in September, a value incorporated by the markets. The new agreement takes production to relatively close (9.75 Mb/d) to this level. Therefore, in terms of supply/demand balance, the new agreement does not fundamentally change previous estimates.
Guy Maisonnier - guy.maisonnier@ifpen.fr
Draft submitted in February 2020
(1) IEA revised its projection in February from 1.2 Mb/d to 0.8 Mb/d due to the effect the coronavirus. It should be noted that the growth in oil demand, within the context of measures adopted to tackle global warming, is likely to start slowing (+0.9 Mb/d per year by 2025) before stagnating in the next five to ten years. However, this evolution is not in line with the objective of limiting the increase in global temperature to below 2°C. That would require consumption to fall immediately.
(2) Taking into account Ecuador, which left the Organization of Petroleum Exporting Countries (OPEC) in January 2020. The statistics and graphs incorporate Ecuador.
(3) On 3 January, an American air raid killed Iranian general Qassem Soleimani and Iraqi military commander Abu Mahdi al-Mouhandis. In retaliation, during the night of 7 to 8, Iran fired missiles against two American military bases in Iraq, although there were no casualties. President Trump’s speech after the Iranian action, deemed by numerous analysts to be one of appeasement, helped allow the oil price to fall back to the $65/b mark having briefly been over $70/b.
(4) The lower range would be consistent with a significant impact of the coronavirus on global economic consumption (uncertain scenario as of 30 January).
(5) It could be justified if the effects of the coronavirus have lasting effects on the Chinese economy.
You may also be interested in

E&P investments. Drilling activities and markets, geophysics and offshore construction (2019)