04.03.2020
30 minutes of reading


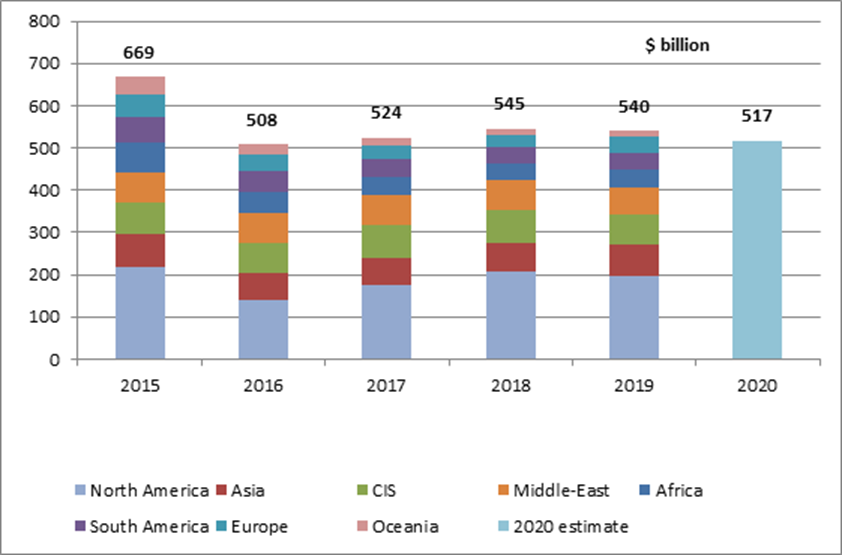
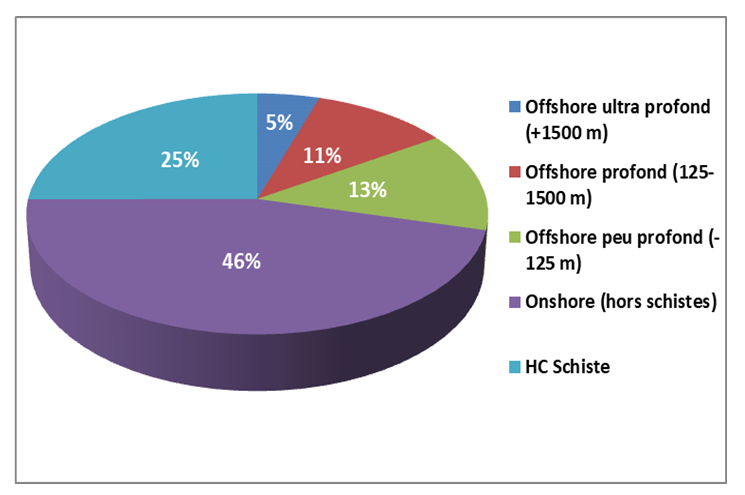
Following the slight upturn begun in 2017 after two years of significant decline, global exploration-production (E&P) investments have fallen again in 2019, dropping 1% compared to 2018 according to figures provided by Rystad Energy. With upstream oil construction costs, as measured by the IHS Upstream Construction Cost Index (UCCI) also increasing by 1.2% in the same period, the decline on a constant cost basis has exceeded 2%. Global E&P investment is estimated at $540 billion in 2019, i.e., $5 billion less than in 2018 and 40% lower than the record figure seen in 2014 (-23% on a constant cost basis). This slowdown is primarily due to North America, which had driven growth in 2018. In 2019, CAPEX in the region has fallen by 7% while in the rest of the world, there has been a modest rise of 2%. The offshore sector accounts for 29% of investments, with the remaining 71% dedicated to the onshore sector, of which 25% to shale oil.
Exploration-production investments
The decline in global investments is set to accelerate in 2020, falling by an estimated 4%1 on the back of continuing decreases in North America as well as a downturn in the rest of the world.
On a constant cost basis, investments have stagnated since 2016 (-0.4%) after a sharp decline recorded between 2014 and 2016. Current levels are not sufficient to ensure the renewal of reserves, which have decreased by 8% since 20142. Over the coming five years, the required average annual investments on a constant cost basis are estimated by IFPEN to be $660 billion, i.e., 22% higher than the figure for 2019. During the period 2020-2040, around $16,700 billion will have to be invested in the upstream oil and gas sector to ensure the production and renewal of reserves3.
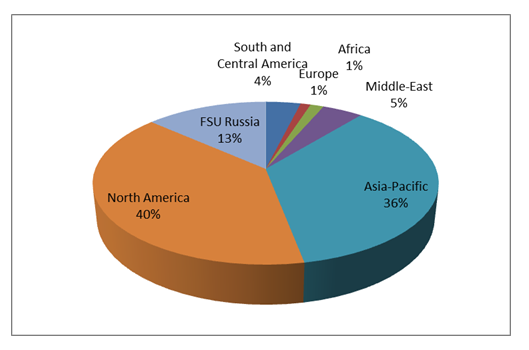
In 2019, capital expenditure has varied by region. In Europe, it has risen by 21%, i.e., $6.7 billion. Asia is ahead of the field in terms of absolute growth with an increase of $7.5 billion, i.e., 11%. In Africa, the increase is also 11% while it is 6% in South America. Elsewhere, investments have fallen substantially by $13.6 billion (7%) in North America. They have also fallen in the CIS (-9%), the Middle East (-7%) and Oceania (-4%). Nevertheless, North America remains ahead of the field where investments are concerned. It accounts for 36% of total world investments, well ahead of Asia, the CIS and the Middle East (12-14% of the total for each region).
In Europe, Norway and the United Kingdom account for 82% of investments in 2019 (of which 56% for Norway). Expenditure has surged in the United Kingdom, increasing by more than 30% compared to 2018, while growth is close to 20% in Norway. Half of total investments have been dedicated to the development of new fields (particularly Johan Sverdup in Norway and Mariner in the United Kingdom), with the remaining 50% used to maintain production at fields brought on-stream prior to 2016 as well as to dismantle infrastructures at depleted fields.
In Asia, China has attracted more than 60% of regional E&P investments in 2019, accounting for nearly 80% of investment growth. The three Chinese NOCs (National Oil Companies) account for almost all (95%) capital expenditure in the country’s upstream oil and gas sector, and this spending has risen by 15%. Sinopec leads the field with a budget increase of more than $3 billion (+63%) compared to 2018, followed by Petrochina (+$1.1 billion) and CNOOC (+$0.8 billion). Elsewhere in Asia, investments have grown by $1.2 billion in India (+19%) and $0.5 billion in Indonesia (+8%) while they have stagnated in Malaysia and fallen sharply by 17% in Thailand (-$0.5 billion).
In Africa, the increase in investments has been driven by Mozambique, Libya, Algeria, Angola and Mauritania. Conversely, investments have fallen considerably in Egypt and Nigeria. In Mozambique, most spending is currently being channeled into the two ongoing LNG projects: Mozambique LNG, led by Total, and Coral FLNG, led by ExxonMobil and ENI. These projects will continue to sustain the country’s investment over the next five years. In Libya, investments have jumped by 35%, driven by the state-owned company but levels are still less than one third of those seen in 2010. In Algeria, Sonatrach’s investments, representing 75% of the country’s total, are up 10%; most of this has been ploughed into the Hassi Messaoud and Hassi R’Mel fields as well as the Skikda and Arzew liquefied natural gas plants. In Angola, the sharp fall in Sonangol’s investments (-26%) has been more than offset by the increase in the budgets of international companies (+38%), led by French company Total. In Egypt, the fall in Capex is primarily linked to the Zohr and West Nile Delta fields, where development operations began in 2016 and 2015 respectively and investments have now tailed off. Nigeria has felt the effects of the fall in budgets allocated by Total and CNOOC to the development of the Egina offshore field, where production was launched in 2018 following five years of development operations.
In Central and South America, investments have picked up in Brazil (+11%, i.e., +$1.5 billion), stimulated by subsalt exploration in the Santos and Campos basins (Lula, Buzios, Jubarte, etc.). Elsewhere, investments have risen sharply by $1.2 billion in Ecuador (+81%), Guyana (+27%) and Colombia (+13%), while the freefall in Venezuela has continued (-41%).
In North America, investments have fallen considerably in the USA (-$14 billion) and Canada (-$3 billion), while they have increased in Mexico (+$3 billion). In the USA, the shale oil sector, which attracts 3/4 of the country’s total upstream oil and gas investments, has seen such investments fall back by 6% (-$7 billion). This decline is due to a redistribution of the portfolio between independent companies, whose CAPEX has fallen by $10 billion, and Majors whose expenditure has risen by $3 billion. Investments in conventional oil and gas have fallen by 14%, with the deep offshore sector, which has shrunk by 30% (-$3.5 billion), particularly affected.
Investments have either stagnated or fallen in all CIS countries, with the exception of Ukraine, where they have increased by 4%. However in terms of absolute value the level remains low since Ukraine only accounts for 1% of the region’s investments. In Russia, which represents 68% of total investments in the CIS region, investments have fallen by 12%, i.e., $6.5 billion. Capex levels have fallen sharply at Gazprom, Rosneft, Lukoil and Surgutneftegas (around -$1 billion each). Investments are stable in Kazakhstan (-0.9%) and have fallen by 5% in Turkmenistan.
In the Middle East, the considerable fall in investments is primarily due to the collapse in spending in Iran (-67%) stemming from oil production restrictions and the withdrawal of foreign investors under the effect of American sanctions. Elsewhere in the region, investments are fairly stable (-0.5%), although falls have been more marked in some countries, particularly Saudi Arabia (-$1 billion, i.e., -4%) and Kuwait (-$0.7 billion, i.e., -14%).
In Oceania, E&P investments have fallen by 7% in Australia (which accounts for 92% of the zone’s investments), coinciding with the completion of several LNG projects. For example, investments have fallen by $1.5 billion compared to 2018 for the Ichthys project, where production operations began in 2018, and by $0.9 billion at Wheatsone where the second production unit was also started in 2018. Conversely, the Prelude and Pluto projects, which came on-stream in 2019, have maintained their investment levels.
To conclude, the timid upturn observed in 2017 and 2018 has not been sustained in 2019 and current forecasts suggest the downturn may be reinforced in 2020. Since 2016, investments have stagnated, or even fallen back slightly on a constant cost basis. They are now around 20% below the level required to renew reserves and will thus have to be increased in the future to meet constantly rising demand.
Global onshore and offshore drilling
In 2019, 68,500 wells were drilled onshore and 2,800 offshore (Fig. 2a). To recap, in 2014, prior to the fall in oil prices, drilling operations worldwide had reached 100,000 wells. In 2019, global drilling operations stabilized (+1%) following the leap seen in 2017 (+25%) and 2018 (+9%).
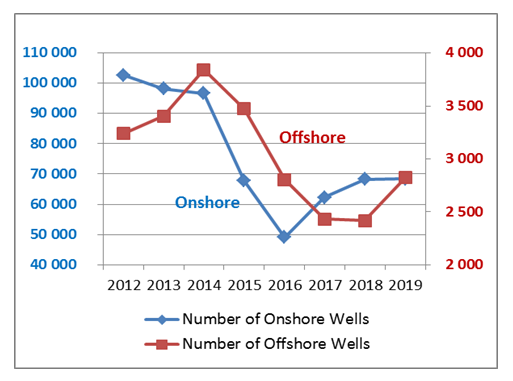
The activity remains 30% below 2014 levels. Onshore drilling activities are globally stable and have not increased, whereas offshore drilling has jumped 17%.
Onshore, over a one-year period, the regions seeing the biggest increases have been Asia-Pacific (+17%), Africa (+13%) and Europe (+12%), with all other regions either stagnating or declining (Fig. 2b). Drilling activities in the Asia-Pacific have been led by China (+20%), where more than 22,000 wells are drilled annually. To compensate for the depletion of its fields, China has reinforced its exploration activities with 3,000 new wells drilled, particularly in the Ordos, Bohai Bay and Juggar basins. Moreover, China has continued its shale gas exploration and development activities in the Sichuan basin and in 2019 the country drilled more than 300 unconventional gas wells. According to estimates provided by China, the Sichuan basin is thought to represent more than 27 Tm3 of resources, i.e., 18% of China’s overall gas potential.
North America is the region that has seen the biggest decline in drilling activities (-9%). This fall is the result of the slowdown in drilling operations in the USA’s shale basins. Of the 28,000 wells drilled annually in the USA, unconventional oil and gas represent 15,000 horizontal wells.
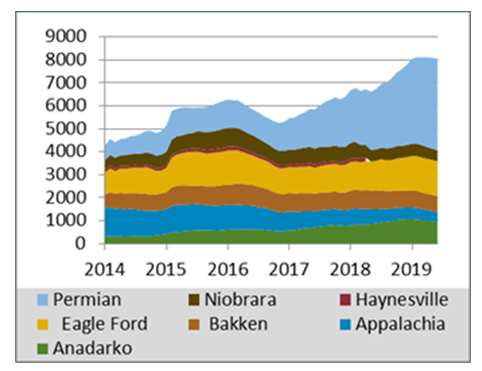
Despite the fall in drilling activities seen in shale basins since the start of 2019, shale oil production in the USA has continued to grow (Fig. 3).
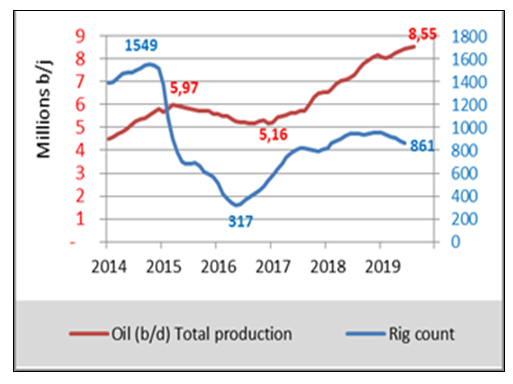
Indeed, the number of meters completed and volumes of proppants injected have continued to increase. However, the increase in 2019 is only likely to be 0.9 Mb/d compared to 2 Mb/d in 2018. Operators use drilled but uncompleted wells4 of which there are more than 8,000 (Fig. 4).
These drilling operations tend to take place when oil prices are low or when export infrastructures are congested, and well completion is delayed. Drilling these wells ensures drilling machines are profitable. In 2018, the removal and transport of the liquids produced suffered from infrastructure under-capacity. Since 2019, the introduction of new pipelines has begun to mitigate this problem. However, congestion is still an issue for the removal of gas associated with oil production. This is because the large quantities of gas produced, the lack of transport infrastructures and the low price of the gas itself do not enable operators to fully exploit it in a cost-effective manner, forcing them to resort to flaring.
At sea, following the decline in offshore drilling in 2017 and 2018, the sector has enjoyed a significant upturn in 2019 (Fig. 5a). The regions in the world with the highest growth rates are Europe (+40%), China (+40%), the Middle East (+27%) and Africa (+19%). In Europe, the activity is being driven by the United Kingdom in the North Sea, Norway in the Barents Sea, and, finally, Romania in the Black Sea. China has a significant fleet of offshore drilling rigs (57). The country intends to revive oil and gas exploration and development activities by removing the obligation to use state-run companies. In the Middle East, Qatar Petroleum and Total have begun the 2nd phase of the development of the giant Al Shaheen offshore field, which is set to account for 50% of national oil production. Finally, the only region where offshore drilling has fallen (-4%) is the CIS.
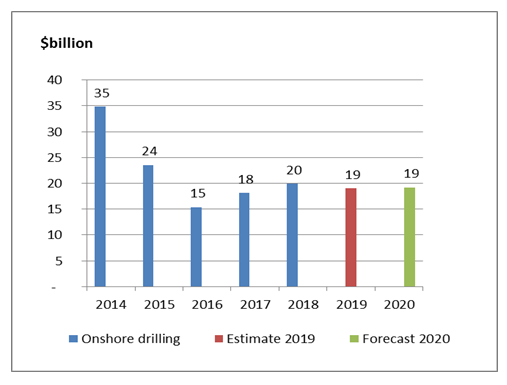
In 2019, turnover (T/O) generated by onshore drilling around the world is likely to stabilize at around $19 billion, a fall of 4% over the year (Fig. 5a). The market is well short of returning to 2014 levels, when turnover was $35 billion.
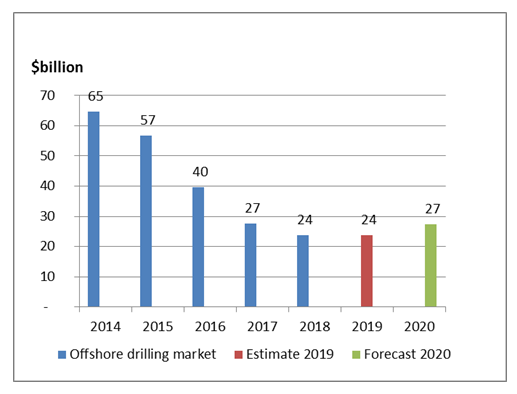
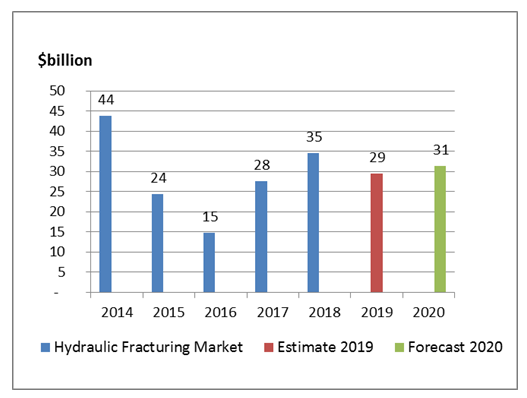
After four years of falls, T/O from offshore drilling is likely to stabilize at around $24 billion - the same as 2018 -, i.e., more than the T/O from onshore drilling with only 2,800 wells. Following two years of very strong growth, the hydraulic fracturing market has fallen by 15% in 2019. However, it still represents a T/O of $30 billion, double that of 2015.
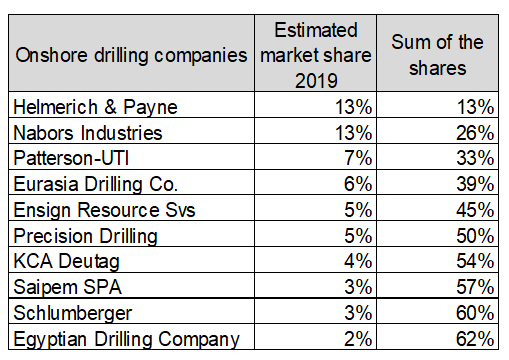
The ten biggest onshore drilling companies account for 62% of the global market (Fig. 6a) and are resisting well compared to smaller companies whose T/Os have fallen sharply. Market growth has run out of steam, primarily following the slowdown in drilling operations in North American shale basins. In 2019, onshore drilling rig rentals may have risen by 10% over a one year period in the USA but in the rest of the world they have fallen by 10%. In 2020, the drilling market is set to stagnate and remain at the same level as 2019.
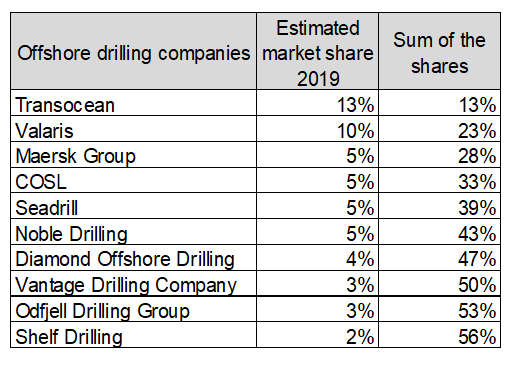
The ten biggest offshore drilling companies account for 56% of the global market (Fig. 6b). Despite a threefold fall in T/O over a five-year period, Transocean remains the leader in the sector. To stay ahead of the field, the company has carried out several merger and acquisition operations, particularly at the end of 2018 with Ocean Rig.
The second biggest player is Valaris, created following the merger of Ensco and Rowan, which, in 2018, were ranked 3rd and 5th respectively. Chinese operator COSL has continued to gain market share but it does not have a drilling vessel among its rigs.
Despite the increase in the number of offshore drilling operations, the drilling rig utilization rate is only 55% globally. This has had a knock-on effect on the offshore drilling market, preventing rig rentals from progressing. Moreover, rigs ordered prior to 2015 and the construction of which had been stopped at the height of the crisis are now arriving on the market.
Also, only a small percentage of mothballed rigs have been dismantled or converted; the others have been brought back into service. Nevertheless, ultimately, given the number of offshore projects under way, it should be possible to absorb any overcapacity and the market should return to growth in 2020.
The hydraulic fracturing market has become one of the E&P sector’s most volatile segments (Fig. 7a). In 2019, it very soon reflected the decline in the American onshore drilling market.
However, the increase in the number of fracturing operations conducted along horizontal drains and the expansion of drains and fracture geometry have led to a considerable increase in well productivity. In 2020, this market is likely to stabilize, with only a slight increase in activity.
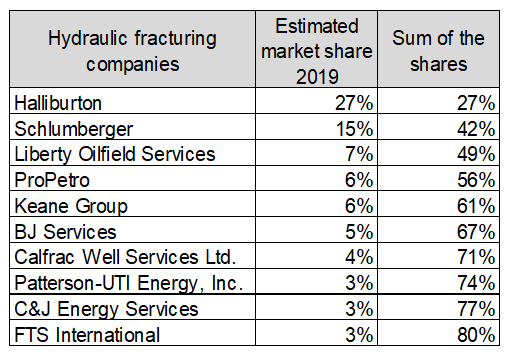
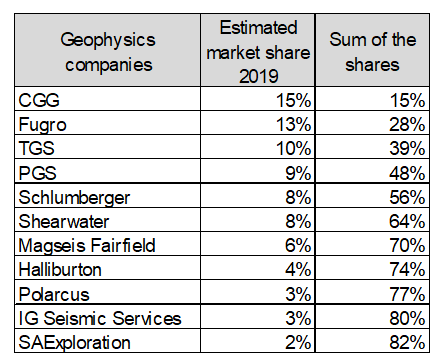
In terms of players (Fig. 7b), the hydraulic fracturing market is highly concentrated with three companies alone accounting for 50% of the global market and ten companies representing 80% of the market.
Halliburton remains the market leader, well ahead of Schlumberger. Over the past three years, Liberty Oilfield Services and ProPetro, ranked 3rd and 4th respectively, have been gaining market share at the expense of Schlumberger.
Geophysics in the world
The geophysics industry is upstream of the development of oil and gas fields and is an indicator of exploration activity. In 2019, activity in the sector has finally begun to recover, with an increase in the number of boats operating and in the size of the global fleet. The price of services, which had fallen since 2014, has recovered in 2019, increasing by between 20 and 25% over the year. The crisis, following the drop in the price of oil in 2015, had a fundamental impact on the positioning of players, with mergers and acquisitions and the reinforcement of the position of Chinese contractors.
Following five years of continuous reduction in the number of seismic survey vessels, 2019 has marked a turning point with a 10% increase in the global fleet.
In mid-2019, there were around 120 vessels of varying types (2D, 3D, source), compared to 110 in 2018 but 140 in 2014.
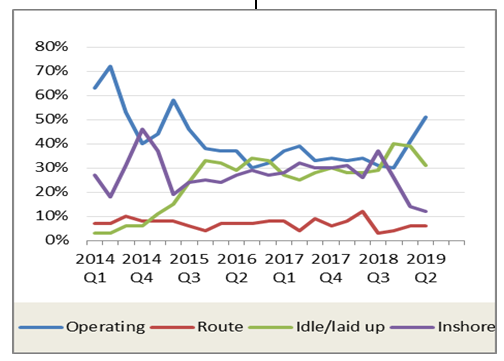
In mid-2019, the percentage of active vessels had risen from 34% to 51% in a year (Fig. 8a). It should be recalled that the figure was between 60 and 70% before the fall in the price of oil in 2015. At the same time, the percentage of inactive vessels decreased by a similar amount, from 30% to 12%.
Sources: IHS Markit et IFPEN
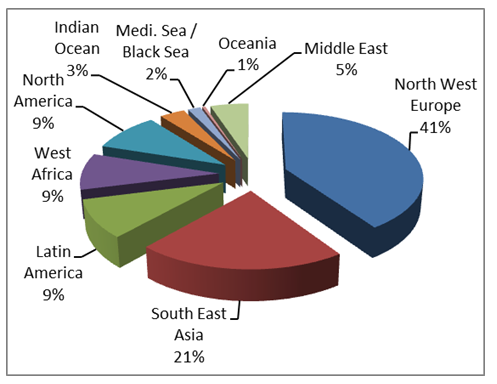
Most vessels in the fleet are located in the five main regions where offshore operations are concentrated: North-West Europe (45%) with the North Sea and the Barents Sea, South-East Asia (22%), Latin America (7%), West Africa (11%) and North America (6%) with the Gulf of Mexico (GOM) (Fig. 8b).
Sources: IHS Markit et IFPEN
Europe is still over-represented due to the high number of Norwegian contractors and boats present.
The largest increases in fleet have been in the Middle East (+170%), North America (+70%) and Latin America (+60%). Western Europe, South-East Asia and Africa have stagnated, while the Indian Ocean, Mediterranean Sea and Oceania have fallen by between 20 and 30%.
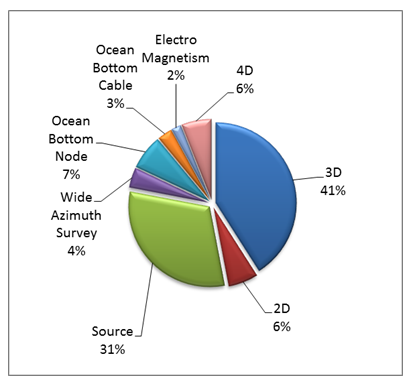
3D marine seismic data acquisition operations have continued to dominate, representing 41% of vessel activity. Multi-azimuth surveys, which had almost disappeared in 2018 due to the high associated costs, have reappeared, representing 4% of total activity. These operations partly explain the increase in the share of active “source” vessels, from 18 to 31% in a year. Another sign pointing to a turnaround in the situation, 2D surveys, which had increased significantly due to the lower associated costs, have halved over the year, only representing 6% of total activity (Fig. 9a).
Globally, specialist marine surveys, using ocean bottom cables (OBCs), ocean bottom nodes (OBNs) or electromagnetism and repeated seismic acquisition (4D)5, represent the same volume of acquisitions (less than 20% of surveys).
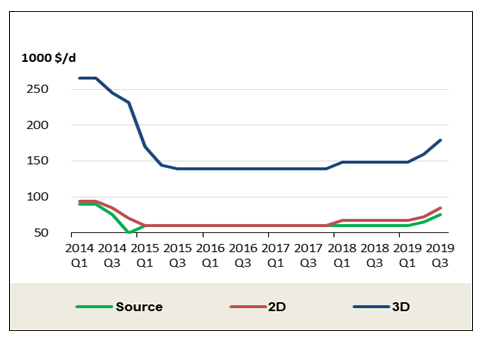
The upturn in activity is reflected in the daily price of surveys, which has increased considerably since the start of 2019 (Fig. 9b).
Sources: IHS Markit et IFPEN
Over a one-year period, the average price of 3D surveys has increased by 20%, while that of 2D surveys has risen by 25%. The cost of a High Level 3D survey is now $250,000/d with a 2D survey costing half or even a third of the amount. Between 2015 and 2017, when the slump in activity was at its height, the price of 2D acquisition was comparable to that of hiring a source vessel. The problems of fleet overcapacity in relation to demand seem to be diminishing.
Following four years of decline in the global geophysics sector, 2018 had already brought with it a return to growth with an increase of 4%. The crisis led to a radical reconfiguration of the market (Fig. 10a).
Sources: Spears&Associates et IFPEN
The weakest players have disappeared, with only those contractors who have succeeded in refinancing and restructuring remaining. SAE Exploration purchased the principal assets previously held by Geokenetics, which went bankrupt in 2018. Magseis bought Fairfield to create a leader in the OBN sector.
In the exploration-production software sector, Emerson bought Paradgim in 2017. WesternGeco, Schlumberger’s marine seismic services subsidiary, and CGG ceased contractual marine activities. Contractors have refocused their activities on geosciences and the sale of multi-client seismic data, the business model for which is now an example to be followed; for the time being, it is more profitable for contractors to live off their libraries of seismic data and multi-client acquisitions. When marine survey prices have recovered significantly enough to cover costs, seismic contractors will be able to justify the acquisition of a fleet of vessels dedicated to contractual data acquisition.
In 2019, CGG is set to continue to reduce its fleet, with the company aiming to have just three vessels at the end of 2019 compared to 12 three years ago. Its objective is to focus primarily on multi-client surveys. Shearwater Geoservices bought WesternGeco’s vessels and now owns 23 vessels, of which only 14 are active. This makes it the biggest global fleet. PGS is set to own a fleet of 8 vessels in the near future.
Spectrum’s acquisition by TGS has been effective since August 2019, with TGS retaining its asset light model based on multi-client surveys and increasing the scope of its 2D and 3D libraries.
Chinese contractors COSL and BGP have been reinforcing their positions in the marine acquisition sector; they have expanded their operations beyond Asia to incorporate Africa and the Middle East.
In 2019, global geophysics market turnover (all segments combined) is expected to rise by 15% to around the $9 billion mark (Fig. 10b).
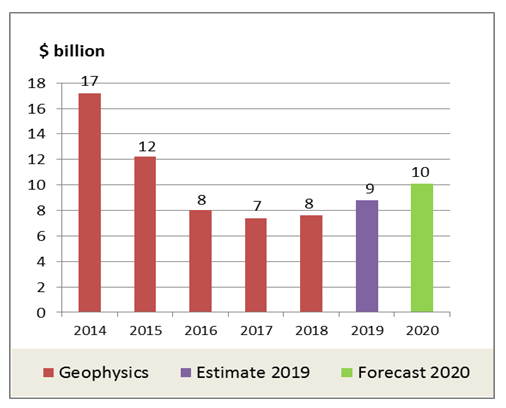
The significant growth in the equipment sector seen in 2018 has continued (+50%), driven by the sale of onshore seismic equipment. Conversely, the offshore seismic sector has contracted.
In 2020, the geophysics market is likely to continue to grow at a rate comparable to that seen in 2019. Nevertheless, in order to leave the crisis behind once and for all and avoid a return to overcapacity in terms of acquisition resources, the companies with the largest fleets of vessels (Shearmater and PGS) will have to take prudent decisions to put them back on the market.
While the global consumption of oil and gas continues to rise, oil and gas operators must pursue their exploration efforts in order to renew their reserves. Volumes of oil and gas discovered over the last three years represent around 10 Gboe per year, while they were between 15 and 20 Gboe prior to 2015. OPEC estimates that $8,000 billion of upstream investments will be required up until 2040 to compensate for the decline in the world’s fields, i.e., around $400 billion annually.
Offshore construction in the world
Offshore represents 28% of hydrocarbon reserves and 28% of world production. 75% of the discovered volumes are discovered offshore. Offering easier access to oil and gas reserves than the onshore sector, this remains an essential sector for the Majors.
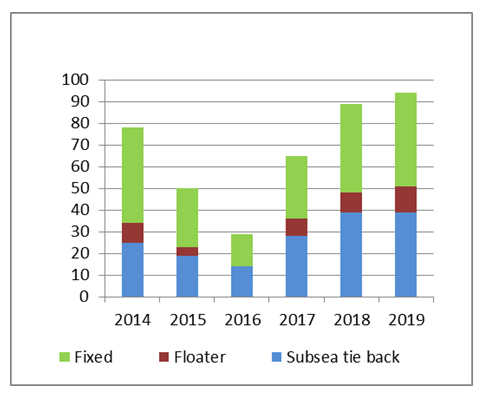
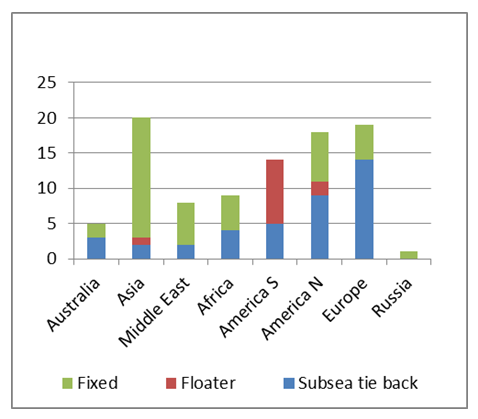
In 2019, the number of offshore projects approved has increased by 6% (Fig. 11a). Since the low point in 2016, this is the third successive year of growth; the number of projects has increased three-fold, with more than 90 projects now approved. Oil and gas companies, after having postponed their development projects, are confronted with the problem of maintaining their production. The return to stability of the price per barrel (above $60) makes the projects previously put on standby viable. Most of the projects (46%) concern fixed platforms, 41% are subsea projects and 13% are floating platforms (FPU6 for deep offshore).
Source: Rystad Energy
Around the world, the number of floating projects is up significantly (33%) thanks primarily to South America (Fig.11b). Indeed, South America is the only region where the majority of projects are floating, with Brazil in particular using numerous FPSO units.
The FPSO is the most popular floating system worldwide, due, in particular, to its technical flexibility and fast production start-up. The other types of floating platforms: TLP, Spar, Semisub and FLNG only represent a few units.
The number of subsea projects7 remains stable (39) over the year. The slight fall in Europe has been offset by project developments in North and South America. This type of development makes it possible, in oil and gas regions that have already been developed, to connect new wells up to existing fixed or floating structures. This is particularly the case in the North Sea and the Gulf of Mexico, where production operations have been conducted for a number of decades.
Source: Rystad Energy
The number of fixed projects continues to grow (+5%). The production method is widely employed in Asia, the Middle East and Africa. It is ideal for shallow-water regions (under 300 meters), where it is cheaper than other methods.
The three geographic zones with the most offshore projects are Asia (21%), Europe (20%) and North America (19%).
In Asia, given the shallow waters, development projects primarily concern fixed platforms (85%). Nevertheless, in India, Reliance and BP have approved the development of the ultra-deep MJ gas condensate field (block KG-D6), which will be connected to an FPSO. In Western Australia, Woodside is launching several gas projects, including the Scarborough field with a subsea connection to the Pluto LNG plant and the Browse project aimed at connecting the Breckneck, Calliance and Torosa fields to an FPSO.
In the Gulf of Mexico in the USA, Shell has taken the final decision to invest in the PowerNap deep water project to which TechnipFMC will contribute. For the development of the Whale field, Shell intends to use a semi-submersible platform very similar to the design of the one used at the Vito field. Murphy Oil has sanctioned the deep water development of the Khalesi, Mornant and Samurai fields, which will be tied back to the King’s Quay FPS.
South America is showing signs of a recovery. In Argentina, the first offshore licenses have been successfully granted, particularly concerning the Falkland basin off Tierra del Fuego. In Guyana, ExxonMobil has validated the second phase of the development of the Liza field. The overall project development costs are around $6 billion, including $1.6 billion dedicated to the FPSO. Brazil is planning two auctions, including one dedicated to subsalt offshore. The auctions in November fell short of expectations, the only bidders being Petrobras and China. As for Pemex, the national company plans to develop around twenty fields in the waters of the Gulf of Mexico in 2019.
In Africa, several offshore development projects have been announced. For example, BP has taken the final decision to invest in the Greater Tortue project, located at the border between Mauritanian and Senegalese waters. BP is also working on the development of the PAJ project off the coast of Ghana. Kosmos plans to use tie-back to develop the G-13 discovery in Equatorial Guinea.
In Europe, Norway has been very active. AkerBP has been given the green light to start production operations at the Valhall Flank West field in Central Graben (46 Mboe of reserves). Equinor has told its partners that commissioning of the giant Johan Sverdrup field (2,200 Mboe of reserves) will be accelerated. In the UK, Premier Oil has approved the imminent development of the Catcher (24 Mboe) and Laverda (4 Mboe) fields.
On the other hand, the number of decommissioning projects in the North Sea is increasing with the number of end-of-life fields. Boston Consulting Group estimates there will be more than 700 platforms to dismantle in the North Sea over the next decade. The number of wells to be abandoned or plugged is set to reach 7,000. For the UK’s oil and gas authority, these infrastructure dismantling operations are estimated to amount to around £50 billion. For Rystad Energy, the short-term market is valued at £6.5 billion. Numerous companies have been created to position themselves in this market: Fairfield Decom, Well-Safe Solutions, Maersk Decom, Offshore Decommissioning Services, Petrodec, etc. However, the problem they face is a lack of market visibility, with operators pushing back dismantling schedules in an attempt to maximize field recovery.
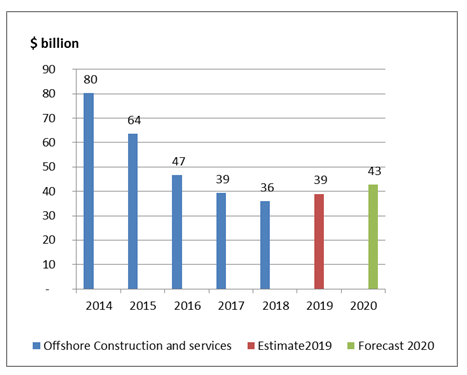
In 2019, the continued increase in the number of projects approved has led to 8% growth in the offshore construction and services market over a one-year period. The market is set to be worth around $39 billion in 2019. This is the second year of growth since the crisis of 2014. Since then, the market, worth $80 billion in 2014, has halved in value.
The market’s three main segments have grown in 2019. The subsea development market segment, which represents 32% of total offshore construction revenue, has increased by 12% over a year. The recovery in Europe is slow, with daily costs increasing, but many subsea companies have not survived the crisis. There is still overcapacity in the vessel fleet.
More than half of the global offshore construction market (54%) comes from platform construction. All types combined (fixed, floating, FPU), this market has increased in value by 6% compared to 2018.
The service and supply ship sector has risen in 2019 by 9%. This market, while reliant on new developments, is also dependent on maintenance and supply operations relating to existing platforms (Fig. 12a).
Sources: IFPEN, Spears&Associates
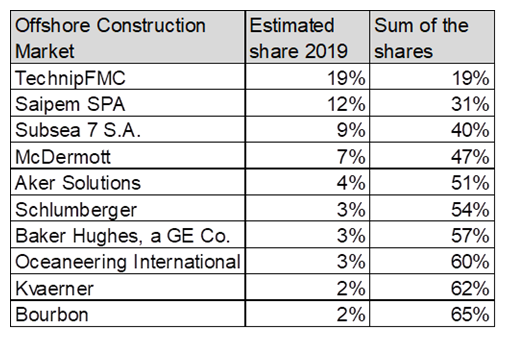
Five companies account for 50% of the global offshore construction market (Fig. 12b).
Sources: IFPEN, Spears&Associates
TechnipFMC is the sector leader with an estimated market share of more than 20%. The company is set to be split into two entities at the start of 2020. The first, which will retain its current name, will be responsible for onshore and offshore oil production equipment; it will be based in Texas. The second, specializing in the engineering and construction of oil and gas production infrastructures, petrochemical sites and refineries, will be based in Paris. It will be called Technip Energies. Italian company Saipem is ranked second in the offshore construction sector, followed by UK-based offshore development specialist Subsea 7. MC Dermott, an American company based in Houston, is ranked fourth.
In 2020, the recovery in the offshore construction sector is likely to continue, with growth at 8%. However, this recovery will depend on the number of projects actually rubber stamped and the increase in service prices.
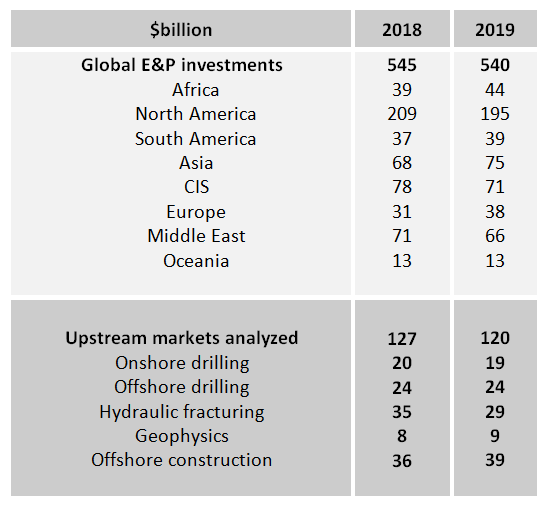
SUMMARY TABLE OF INVESTMENTS AND MARKETS (2018 and 2019)
Geoffroy Hureau - geoffroy.hureau@ifpen.fr
Sylvain Serbutoviez - sylvain.serbutoviez@ifpen.fr
Draft submitted in February 2020
(1) According to data provided by Rystad Energy
(2) Ibid. Proven reserves
(3) IFPEN estimate with demand hypotheses from the IEA SPS scenario
(4) DUC (Drilled UnCompleted)
(5) A 3D seismic is called 4D when it rigorously repeats the acquisition scheme of the first 3D seismic reference
(6) FPU: Floating Platform Unit, storage, liquefaction or production platform
(7) A subsea project is developed without a platform but from subsea wellheads and connectors (tie-backs) to existing infrastructures
You may also be interested in