

01.02.2018
30 minutes of reading


The world’s third largest energy consumer, India is currently posting the strongest growth in gross domestic product (GDP) among G20 nations. Since 2014, India’s economic momentum has been combined with a drive toward large-scale transformation of its industrial policy with the launch of “Make in India”. In this environment, India faces many challenges, as New Delhi must manage its growing dependence on external supply and a new growth model against the background of a global energy transition.
Relative to its population and the vastness of its land (3,287,263 km², about six times the size of France), India has very few energy resources. Though it has the world’s second highest population after China1 with around 17% of the world’s population, it only holds 0.65% of global gas reserves, 0.3% of oil reserves and 8.3% of coal reserves (BP Statistical Review, 2017). With 3% of world GDP in 2016, compared with 1.6% in 1980, India has posted accelerating growth since the early 2000s, reaching a peak of more than 10% in 2010. Since then, India has maintained approximately 6.8% growth, reaching a high point of nearly 8% in 2015, thus allowing New Delhi to take the lead in economic growth among G20 nations. Following the 2014 election of Narendra Modi, India has entered a new era of economic development with the launch of its Make in India policy. It is intended to accelerate the country’s industrialization, allowing it to play a more powerful role in the international markets.
However, faced with the current challenge of climate change, India’s economic and energy policy is being tested. Though the world’s third largest consumer of energy — behind China and the United States — has maintained investment around $10 billion in renewable energy since 20152, i.e. around 4% of worldwide investment, its industrial proactivity and energy and oil policies raise numerous questions. The first involves New Delhi’s ability to combine industrialization with the fight against climate change. The second concerns India’s ability to help its leading energy operators to emerge, permitting it to manage its dependence on external sources.
Its energy appetite weakens this massive country, through its growing dependence on imports
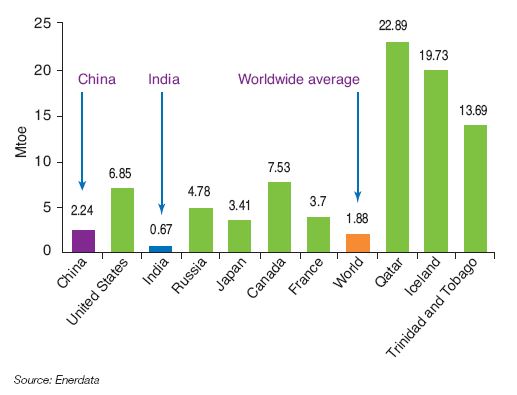
The world’s third-largest energy consumer, India doubled its consumption between 2000 and 2016 (Fig. 1). However, its per capita consumption (0.67 toe3) remains relatively low, representing just one-third of average worldwide consumption and one-quarter of Chinese consumption (Fig. 2). India currently represents just 6.5% of the world’s energy consumption, far behind China (22%) and the United States (16%). Demand for energy has risen an average of 5.1% per year since 2006, compared with 3.9% during the 1990s.

consumers and growth between 2000 and 2016 (in %)
In the oil markets, India now ranks third in both consumption and imports. However, nearly 15% of imported oil is reexported within the region in the form of oil products. Indian oil production has remained stagnant for nearly ten years at around 0.85 Mb/d. On the coal market, India is the fourth largest producer in the world with nearly 8% of worldwide production, with its consumption representing around 11% of the world’s total in 2016. India has a limited presence in the gas markets as a producer (0.8% of the international total) and as a consumer (1.4% of global consumption).
India depends on outside markets for nearly 81% of its oil (Fig. 3), 55% for gas and 30% for coal. In the oil markets, during 2015 India imported 59% of its oil from the Middle East, with Saudi Arabia as its top supplier (20%), followed by Iraq (17%), African countries (19% including 11% from Nigeria alone) and Venezuela (11%).
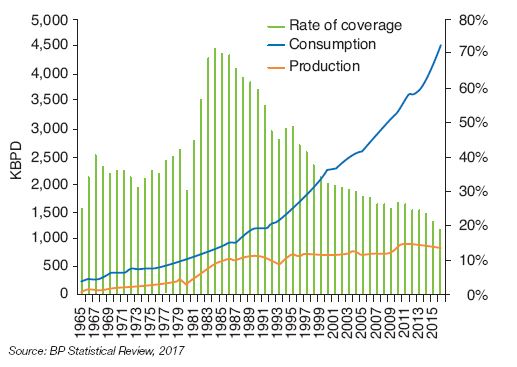
barrels/day) and rate of coverage of oil consumption by production
(in %) in India since 1965
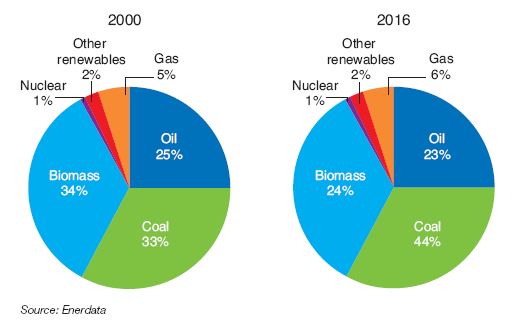
India’s energy mix largely depends on coal (Fig. 4), which represents 44% of primary energy consumption, and more generally fossil fuels (73 %). In the power system, coal represents 62% of production capacity and nearly 75% of electricity production in 2016 (Enerdata, 2017). An oil and coal issues are still at the heart of Indian managers’ energy concerns, while gas (8% of electricity production) remains somewhat back. Forecasts for consumption in 2040 tend to reinforce this view. According to projections by the International Energy Agency (IEA), oil demand in India should reach nearly 10 Mb/d, with oil imports doubling compared with 2015.
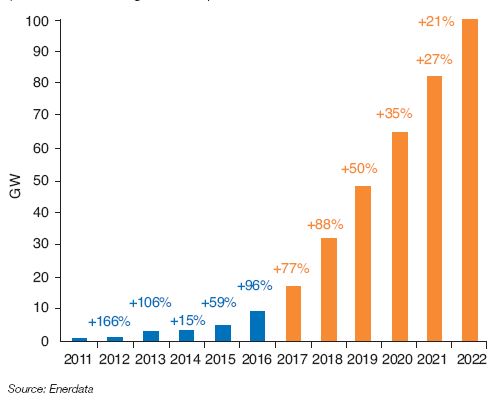
(in GW and annual growth rate)
The share of coal rose 12 points since 2000, mainly to due the development of coal-fired power plants and the use of coking coal in the steel industry (IEA, 2015). The weak price of coal with regard to other energy sources was an important factor in its use in India during this period. With the fifth largest coal reserves worldwide (8.2% of the world total) and a reserves-to-production ratio estimated at 137 years (BP, 2017), there is a risk that it will remain a major primary energy source in the coming years.
At the same time, the Indian government has put forth ambitious objectives in the renewable energies sector4. They are expected to represent 175 GW by the end of 2022, with 60 GW in wind power, 10 GW in biomass and 5 GW in smallscale hydropower. The solar energy sector alone should represent 100 GW — around 1.6 times the nuclear power stations operating in France — and includes 40 GW in solar roofs and 60 GW in power plants (Fig. 4). During the COP21 held in Paris during November 2015, India, along with France, launched the International Solar Alliance (ISA). The ISA brings together 121 countries with significant solar resources that have committed to advance the use of solar energy at the international level. By last November, 19 countries had ratified this agreement, allowing it to take effect at the beginning of December 20175. Its first objective is to raise $1 trillion to finance the global solar revolution.Through this initiative, India hopes to impact the 300 million Indians who are not connected to the power grid (around 20% of the population) and to use solar applications in the agricultural sector. In addition, the ISA provides India with a real basis for diplomatic cooperation, particularly with African countries.
India also has 21 nuclear reactors spread over six sites, with a total capacity of 5.7 GW, which is less than 2% of its total installed power capacity (300 GW total capacity (Fig. 5). In 2017, five new nuclear reactors were under construction with additional capacity of 3.8 GW6. The investment plan calls for 14.6 GW in installed capacity by 2020, followed by 63 GW in 2032. India aims to make massive investments nuclear power, which could eventually represent 25% of power generation in 2050, ranging between 150 GW and 200 GW of nuclear capacity installed in the country. However, numerous studies estimate that, taking cost, time, construction and acceptance limitations into account, only 55 GW could be installed by 2050.

Development of nuclear power in India could speed up in the coming years, in view of the many advantages: the political will to achieve energy independence, numerous bilateral agreements with countries and companies (France, Russia) and technological expertise.
Rising oil consumption, insufficient investment in exploration-production
Primarily driven by demand in the transport sector (46% of end oil consumption), oil consumption rose by 84% between 2000 and 2015. Despite a 2017 slowdown7, it is expected to rise in 2018, in line with accelerating economic growth. Nevertheless, the share of oil in the energy mix remained relatively stable from 2000 to 2016 (one-quarter of primary energy demand) (Fig. 6).
Faced with substantial dependence on foreign oil markets (81%), India currently seems ready to revive its oil exploration, both domestically and overseas. The government aims to reduce dependence by 10% by 2022, attracting nearly $40 billion of investment in the exploration and production sectors over the next five years9. This decision was made when oil prices were low, while domestic production has been nearly stagnant for two decades. At this time, low Indian oil reserves and the administrative complexity in this sector have never managed to attract the investment needed for its development (Fig. 7), especially since it had to await implementation of the NELP regime (New Exploration Licensing Policy) in 1999 so foreign companies could take part in auctions of the various blocks offered by the government. Between April 2000 and June 2017, the sector only attracted $6.8 billion in investments, i.e. 2% of total foreign direct investment (FDI), a low figure compared to the $40 billion hoped-for by the government.
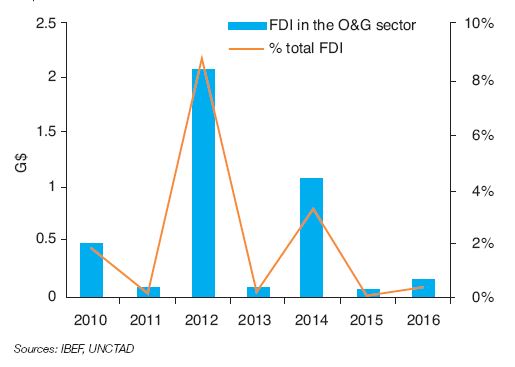
in $billions
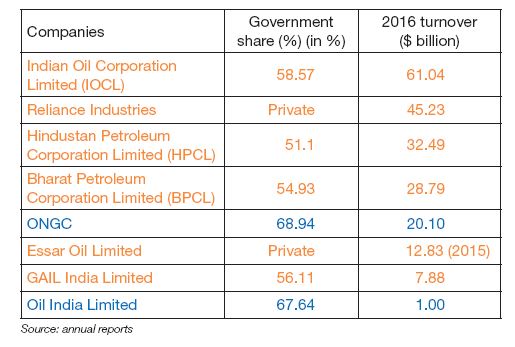
The most easily accessible reserves are already under commercial development, and national companies (NOCs) (Table 1) still lack the technical efficiency to exploit certain deposits. The weak presence of international companies (IOC) and, ultimately, the lack competition for Indian NOCs does not push them to improve their performance.
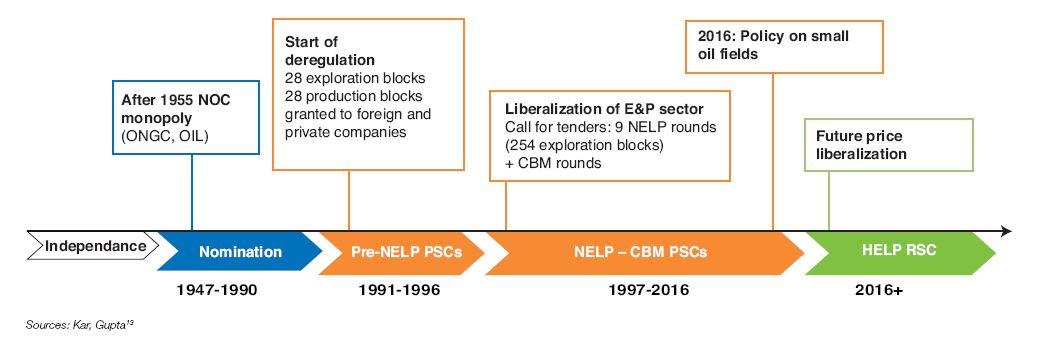
Reform and liberalization of the Indian oil market
Traditionally, oil and gas has been the exclusive domain of the Indian government. The first regime in place, known as Nomination Basis, ensured that petroleum operating licenses (PEL) were granted to national oil companies (ONGC, OIL). However, since the early 1990s, the productivity of most deposits has declined, and the Indian NOCs were forced to address their technological and financing limitations. Against a background of rising domestic oil demand, in 1999 the government finally adopted a new exploration licensing policy (NELP) to open its market to foreign companies. Since then, concessions have been awarded through nine international calls for tender, the last of which took place in 2011. Nevertheless, the Indian oil market remains dominated at the national level by a majority of Indian NOC10 participants, with IOCs relatively absent from calls for tender.
In the interest of increasing local oil production, new policies11 were promulgated between 2013 and 2016 to monetize oil resources and attract investment to the upstream sector (Fig. 8). These measures focus on relaxing regulations, liberalizing domestic production prices and offering a new model for revenue-sharing agreements between producers and the government12.
Indian NOCs remain poorly integrated with a weak international presence
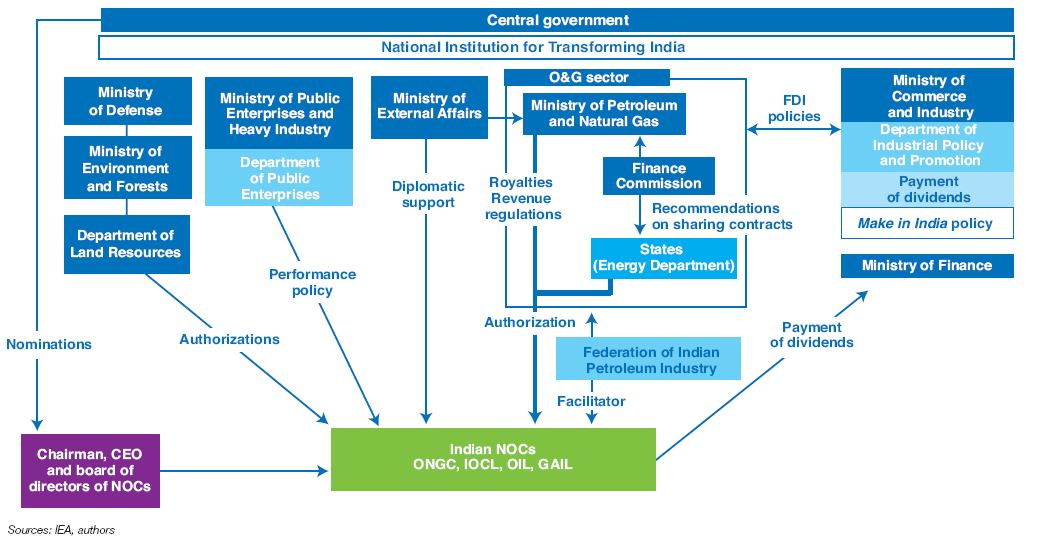
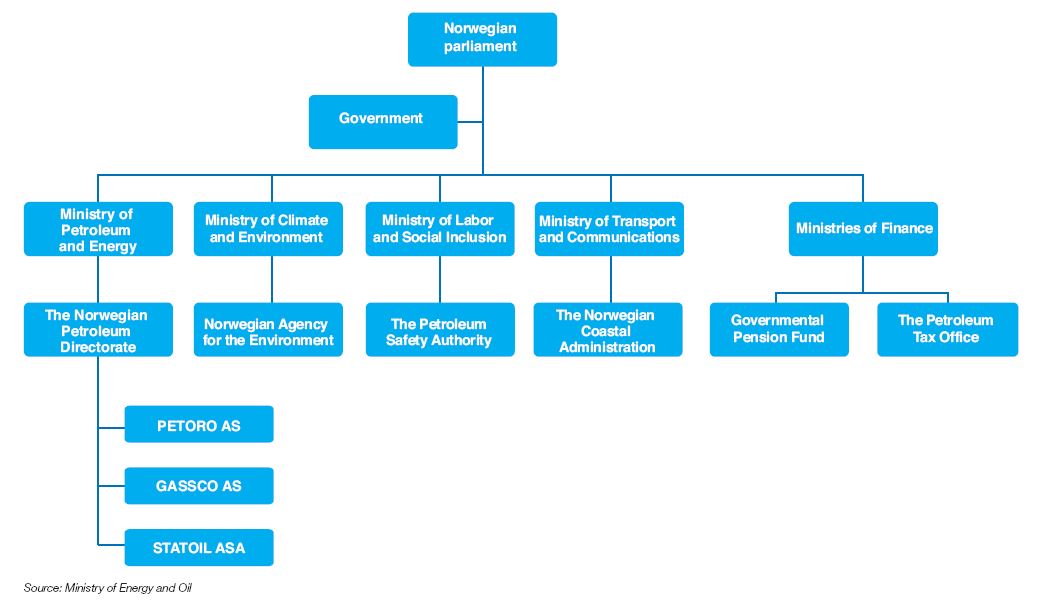
India currently has two main categories of players: NOCs (ONGC, OIL, IOCL, etc.) and private Indian companies (Essar, Reliance) (Table 1). Except for a few partnerships (BP, Shell, Cairn India), IOCs have a very small presence in India. In addition, the sector remains highly compartmentalized, with relatively poor integration and dependent on an extremely burdensome institutional structure (Fig. 9), especially when compared to a country like Norway (Fig. 10). The large number of principals, the fragmented structure of entities granting operating authorization at central and local levels, along with the Indian bureaucracy does not encourage outside operators to invest in the country.
and turnover (companies in orange operate downstream,
companies in blue operate upstream).
Players are positioned either upstream or downstream from the value chain. The latter segment is 60% dominated by NOCs, of which IOCL represents the greatest share with 30% of the country’s global capacity. Two major private companies, Reliance Industries (25 %) and Essar Oil (8.7 %), complete the Indian refining landscape. As with the upstream oil sector, private companies only began to enter the market around the year 2000. Today, refining capacity exceeds demand in India, and the country would like to become a future refining hub in the Asian market. Theupstream sector is very dynamic, with more than 17 Mt of additional capacity planned by 2020, along with a number of projects planned in the petrochemical sector. In the upstream sector, ONGC and Oil represent 60% and 9% of oil production respectively, leaving little room for private players. In the gas sector, public companies represent nearly 80% of production.
NOC growth strategies are consistent with those of the government with two major objectives: development and diversification of assets, both domestically and internationally. Domestic oil companies are encouraged to purchase interests in oil assets on foreign markets. However, except for ONGC Videsh14 (ONGC’s oversea’s arm), state actors remain very reserved with a tiny presence.
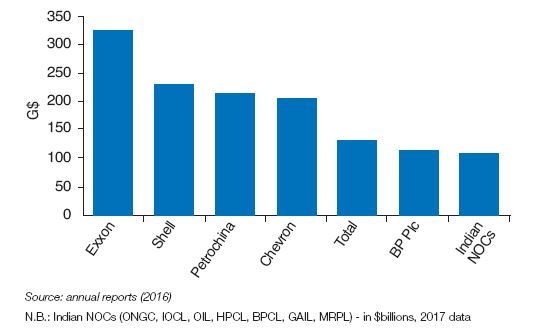
In comparison to IOCs or even Chinese NOCs, Indian NOCs remain relatively modest in size, with limited integration. Formation of a single integrated Indian national company through mergers and acquisitions among the eight Indian NOCs is one of the government’s stated goals. Together, Indian NOCs would represent a market value of nearly $112 billion15, comparable in value to an IOC (Fig. 11).
Indian NOCs consolidated
In July 2017, the government authorized ONGC to acquire a 51.1% interest in the national refining company HPCL. This transaction heralds a broader move toward consolidation in the sector.
Deployment of electric vehicles and the challenge of charging infrastructure
The government has already announced measures to electrify its automotive fleet by 2030. It is a highly ambitious goal, which will increase demand for metals and energy (especially coal) to meet the new needs of the automotive and electricity sectors. Electric vehicles already enjoy a 12%16 tax rate, more advantageous than the rate for combustion vehicles (28%). However, the batteries — which are sold independently — are still subject to a 28% tax rate. This is a significant barrier to the government’s proposed development model based on battery swapping17, which could be of interest in the case of large vehicle fleets.
In India as in the rest of the world, the main challenges remain recharging infrastructure and the high cost of battery production. The country has a significant advantage over developed nations: a rapidly-expanding automobile fleet! India currently has just 23 cars per 1,000 residents, which promises a substantial volume of automobile production over the short term, and a window of opportunity against a background of falling costs.
Make in India: the challenge of industrial development
Streamlining specific to the oil industry is part of the country’s more comprehensive industrialization policy, known as Make in India.
In December 2015, during COP21 in Paris, the Minister for Power, Coal and Renewable Energy, P. Goyal, affirmed India’s desire to double its domestic coal production to meet future demand and reduce its dependence on imports18. This statement was accompanied by a message that reflected New Delhi’s mindset, focused on the fact that a country emitting only 3% of global emissions with 17% of the world’s population should not have to make sacrifices regarding its industrial policy or, more broadly, to its economic growth. Declared a model-COP country by various analysts, mainly due to its investment in renewable energies, New Delhi follows a proactive industrial policy. While in India the services sector represents nearly 54% of GDP (Table 2), since 2014 the country has been implementing a vast industrialization plan with its Make in India program, enabling it to raise the manufacturing sector’s share to 25% by 2022 and to nearly 30% of GDP in 2040, compared to 16% currently (http://www.makeinindia.com/home) and to create nearly 90 million jobs. Contrary to China, whose manufacturing sector has been a driving force since the 1980s with growth exceeding 10% per year, the services sector is partly responsible for driving growth in India, particularly the business services sector, and more broadly the information and communications technologies sector (ICT). Make in India expressly aims to develop 25 very different sectors19, including 4 related to energy: the oil and gas sector, the renewable energies sector, the power sector and the mining sector. They include sectors that are labor-intensive (textiles, agrifood), capital goods sectors (machine tools and construction, transport), strategic industries (aerospace, electronics, defense and solar energy) and industries in which India has a competitive advantage (pharmaceuticals, IT).

Sector-based breakdown of GDP and employment
in China and India in 2016
This policy expressly aims to promote investment in the manufacturing sector and to make India a hub for regional and international markets. The Indian government also hopes to better integrate national companies into global industrial production lines, and to improve the global competitiveness of its industry. This policy relies on the creation of national investment and manufacturing zones (NIMZs). They are not only economic zones that offer tax benefits for international investments, but must also combine production units, administrative centers, housing and environmental excellence. The comparison with special economic zones (SEZ), established in China in 1979, and free-trade zones (FTZ), created in 2013 offers hope, since SEZs and FTZs were part of the Chinese economic take-off in the 1980s and 1990s, due to their powerful attractiveness to foreign direct investment (FDI)20.
The Make in India policy also relies on the country’s many internal strengths: a world-renowned class of engineers due to the outstanding Indian Institutes of Technology (IIT)21, average salaries in the manufacturing sector less than half of those in China (AT Kearney, 2015), highly dynamic domestic consumption of manufactured products and a young working-age population. On this latter point, India is among the rare nations, with Iran and Brazil, that has a demographic window of opportunity in the coming years22.
The median age of the Indian population is expected to reach 32 by 2030 (compared with 43 in China, 49 in Germany and 52 in Japan), ensuring inexpensive labor for the manufacturing sector. It is estimated that nearly 64% of the Indian population will be of working age in 2026, with people over age 60 making up just 13% of the population23. Make in India could propel a new national economic resurgence, allowing it to catch up with its neighbor China, specifically regarding per capita GDP. Though in 1992 both countries had the same per capita GDP in today’s dollars, by 2016 China’s was 4.7 times higher at around $8,100 (World Bank, 2017).
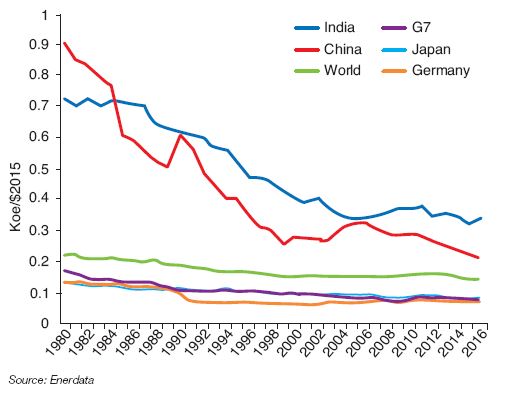
In theory, India also has the entrepreneurial structure — major groups (Birla, Mahindra, Reliance, Tata, etc.) and Indian subcontractors (estimated at more than 50 million) — needed to take part in worldwide production chains, and several major industrial regions (Bombay-Pune, Bangalore, Hugli, Gurgaon, etc.). However, the limits are very real: concentration of activity, lack of infrastructure, the isolation of certain SEZs and weak positive externalities outside of these regions continue to limit the spillover effects (growth, jobs) of these policies. Numerous other questions are raised, such as the consequences of the energy consumption and greenhouse gas emissions linked to implementation of this policy, since the industrial and power sectors are the main consumers of primary energy sources in India. Progress made in Indian industry’s energy intensity was significant between 1980 and 2004 but has tended to stagnate since that time. In 2016, Indian industry’s energy intensity was 1.5 times greater than China and 2.5 times greater than average worldwide intensity (Fig. 12). Since then, Indian industrialization, assuming industrial relocation in countries such as China, will not be achieved with energy iso-consumption and greenhouse gas iso-emissons. Of course, the Make in India plan and all industrial corridors are supposed to become true standard-bearers for an India attractive to foreign investors, the epitome of industrial modernity: governance, energy efficiency, sustainable transport and connectivity24. However, it is fair to assume that, at the very least, initial implementation of this plan will include a significant carbon footprint. Lastly, the rate of urbanization should reach around 47% within the life of the Make in India plan (2040) and energy consumption should rise by a factor 3 compared to 201225.
Conclusion
India, which boasts the world’s second largest population but ranks 144th in GDP per capita, must support industrialization and economic growth over the long-term to meet the employment and income needs of its population.
The Make in India policy, in place since 2014, demonstrates its desire to attract foreign investment in numerous sectors and to at last take its place on the world stage, following the example of China over the past decade. In India’s current technological situation, sustained economic growth can be achieved through rising energy consumption, even though the country is already the world’s third highest consumer. In a country with few energy resources (except for coal), the question of energy independence is currently one of the government’s top priorities. While it intends to develop renewable energies in the future, its fossil fuel policy demonstrates a clear intent to prioritize the country’s economic future over the short term. In the grip of pollution problems, as seen in recent episodes of atmospheric pollution in New Delhi26, India must now find a way to favor convergence between economic growth, reduction of its energy dependence and response to climactic and environmental demands.
Marine Simoen – marine.simoen@ifpen.fr
Final draft submitted in February 2018
(1) India had more than 1.324 billion residents in 2016, compared with 1.379 billion in China (World Bank data)
(2) By comparison, China invested nearly $78.3 billion in 2016, 33% of the world’s total (Irena, 2017)
(3) Ton oil equivalent
(4) Approximately 62 GW are currently connected to the Indian network
(5) To date, 48 countries have signed the agreement and 19 have ratified it: http://isolaralliance.org/MemberCont.aspx
(6) Nuclear Power in India, World Nuclear Association, accessed June 2016: http://www.world-nuclear.org/info/Country-Profiles/Countries-G-N/India/
(7) In part due to slower GDP growth following the demonetization of 500 and 1,000 rupee notes and delayed investments in anticipation of a new tax on goods and services (GST) that took effect in July 2017
(8) Primary energy consumption was 37,344,611 Tj in 2016, compared with 18,456,655 Tj in 2000, thereby doubling over the period
(9) India to attract investments of over $40 billion in oil and gas by 2022: Pradhan, The Hindu, October 26, 2017
(10) This was confirmed by the Herfindahl Index (HHI) study conducted by Sen and Chakravarty (2013), which showed that five out of nine auction rounds (NELP II to VI) had HHI indices significantly higher than 1,800 indicating a highly dominated market. The HHI index represents the concentration of players, with HHI <1,000 indicating a competitive market, HHI between 1,000 and 1,800 a moderately dominated market, and a HHI index >1,800 a highly dominated market (Iledare et. Al., 2004)
(11) The main ones are the HELP (Hydrocarbon Exploration & Licensing, 2016), DSF (Discovered Small Fields, 2015) and PEC (Production Enhancement Contracts, 2016) policies
(12) Johnston and Johnston (2015) proposed a critique of these two revenue models
(13) Natural Gas Markets in India, Springer (2017)
(14) ONGC Videsh has interests in 37 E&P projects, 14 O&G production projects and holds two investments in pipeline projects
(15) Including $36 billion from E&P companies and $76 billion from refining
(16) Under the new goods and services taxation regime (GST) that took effect in July 2017
(17) This system is based on replacement of the vehicle’s discharged battery with a new precharged battery to avoid long charging times. However, its requires a significant battery inventory and technological consistency within the automobile fleet
(18) Between 2010 and 2015, the share of imported coal rose from 12 to 25% (https://www.pwc.in/assets/pdfs/publications/2016/icc-pwc-coal-report-june.pdf)
(19) Automobile, automobile components, aviation, biotechnology, chemicals, construction, defense, electrical machinery, electronic systems, food processing, IT, leather, media, mining, oil and gas, pharmaceuticals, ports and shipping, railways, renewable energy, roads and highways, space, textiles, thermal power, tourism, wellness. (http://www.makeinindia.com/home).
(20) However, India was the trailblazer for this type of policy, with its 1965 implementation of Export Processing Zones in the state of Gujarat. However, India’s administrative burdens and the greater attention given to the agriculture sector following the famines in the mid-1960s led to the rise of these special economic zones
(21) The IITs are public higher education institutions to train engineers. Founded in the 1950s, there are 18 of these high-level institutions, uniformly distributed across India. Admissions are highly selective
(22) According to the UN, a demographic window of opportunity exists when the proportion of children age 1 to 14 is less than 30% of the population, and the proportion of seniors (+ age 65) is less than 15% of the population
(23) EY, Reaping’s India promised demographic dividend, January 2014
(24) For example, the Delhi-Mumbai industrial corridor (DMIC) alone will include eight NIMZs and seven smart-cities, and will extend over nearly 1,500 km
(25) Draft National Energy Policy, Government of India, June 2017
(26) A November 2017 study by the Center for Science and the Environment (CSE report) assigns 30% of premature deaths resulting from air pollution to India