

08.10.2026
15 minutes of reading


Summary:
- Biofuels in the Road Transport Sector
- Spotlight on Biofuels in the Aviation Sector
- Toward the Emergence of Biofuels in Maritime Transport?
- Focus on France
- Outlook for Carbon Neutrality by 2050
- Global Biofuel Market Evolution in IEA World Energy Outlook Scenarios
- Evolution of the French Biofuel Market in the SNBC 3 Pathway
 Download the Biofuels Dashboard 2026 (PDF - 1.8 Mo)
Historically developed in the 1970s and then more widely deployed in the 2000s as substitutes for fossil fuels in road transport, biofuels are now being progressively incorporated into fuels used in internal combustion engines across all transport modes, with notable growth in aviation and increasing substitution for diesel fuels and heavy fuel oils in maritime, rail and non-road transport.
In 2025, global biofuel consumption reached nearly 120 Mtoe, of which 94% was still used in road transport, 4% consisted of biodiesel and renewable diesel consumed in non-road transport modes, and 2% was biokerosene used in the aviation sector.
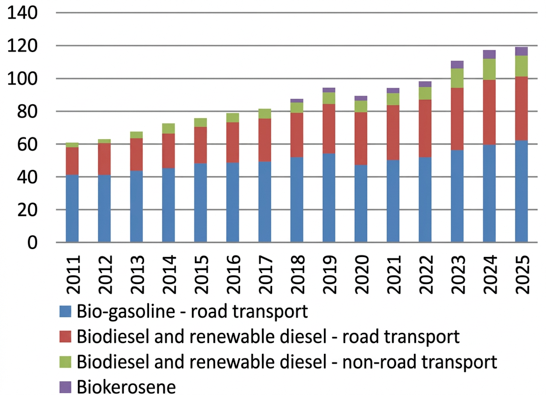
Source: IFPEN, based on S&P Global.
Although overall market growth continued, it appears to have slowed slightly (+2% between 2024 and 2025, compared with +6% between 2023 and 2024), mainly due to stagnating energy demand in road transport.
 Biofuels in the Road Transport Sector
Global energy consumption in the road transport sector exceeded 2.2 Gtoe in 2025, representing an increase of 0.75% compared with the previous year. Excluding 2020, which was marked by a sharp decline in mobility demand due to the COVID crisis, it had been several decades since annual growth in road transport energy consumption had fallen below 1%.
Following a strong increase of nearly 5% between 2023 and 2024, the share of alternatives to fossil gasoline and diesel fuels (biofuels, LPG1, NGV2, and electricity) remained stable between 2024 and 2025. In 2025, these alternatives accounted for 9.4% of fuels consumed, representing more than 209 Mtoe (compared with 208.4 Mtoe in 2024 and less than 200 Mtoe in 2023).
Among these alternatives, biofuels represented 112 Mtoe, corresponding to a market share of more than 53% of alternative energies and 5% of all energy consumed in road transport (Fig. 2). The incorporation rate of biofuels into road gasoline and diesel reached 5.2% in 2025, remaining virtually unchanged in line with overall road fuel consumption. Between 2024 and 2025, electricity was the only alternative energy to record double-digit growth (+15%), while still representing the smallest share among alternative fuels.
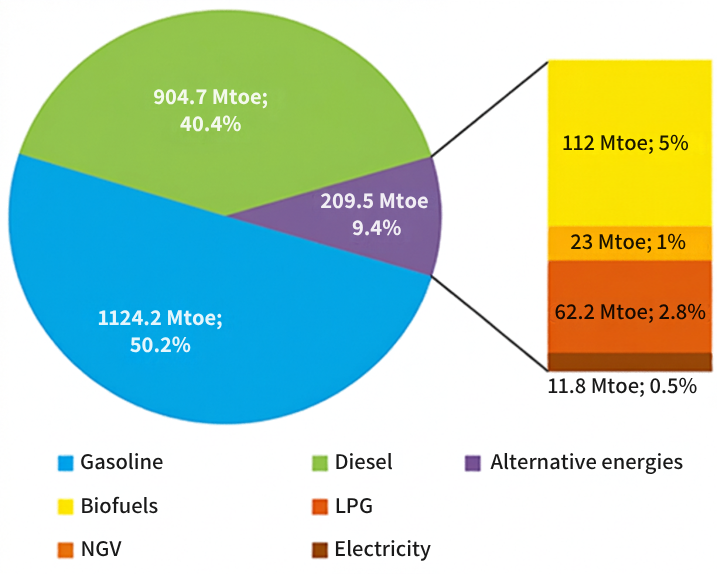
Source: IFPEN, based on Enerdata and S&P Global
Among the road transport biofuels consumed in 2025, ethanol, the main substitute for gasoline, recorded annual growth of 5%, compared with growth of only 1.2% in demand for petroleum gasoline. Global ethanol consumption therefore reached 62.8 Mtoe in 2025.
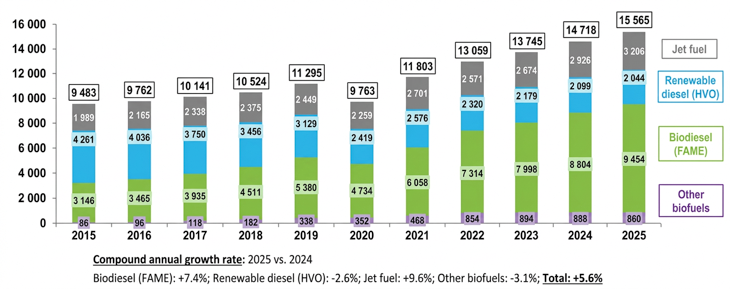
As for biofuels substituting road diesel, after reaching a record level of 52 Mtoe in 2024, consumption declined slightly to 49 Mtoe in 2025 (Fig. 3). From a technological perspective, this trend has affected both FAME (Fatty Acid Methyl Ester) and HVO (Hydrotreated Vegetable Oil) pathways in a similar manner. For several years, these two technologies have accounted respectively for around 70% and 30% of the road renewable diesel market.
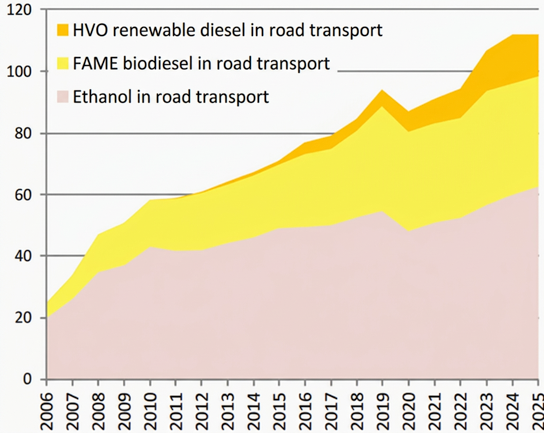
Source: IFPEN, based on S&P Global
At continental level, biofuel incorporation rates in road fuels also remained generally stable between 2024 and 2025. Rates vary by region, but Latin America still records the highest level (11.7% on an energy basis), supported by the Brazilian ethanol market, which alone achieves an ethanol blending rate of nearly 40% in gasoline. North America and Europe follow, with incorporation rates of 8% and 6% respectively. In Asia, the rate continues to increase each year and reached 3.1% in 2025.
In the European Union (EU), liquid biofuel consumption remained virtually stable at around 17 Mtoe (and close to 20 Mtoe across the European continent as a whole).
The Asia-Pacific region once again recorded the strongest growth in consumption, rising by 15% to 22 Mtoe, whereas North America experienced its first market decline since the COVID crisis, falling by approximately 10%, equivalent to a reduction of 5 Mtoe compared with 2024.
Gasoline Substitutes
Since the emergence of the biofuels market, ethanol has remained the primary substitute for gasoline fuels worldwide. Globally, ethanol consumption increased by 5% between 2024 and 2025, while production rose by 2.4%.
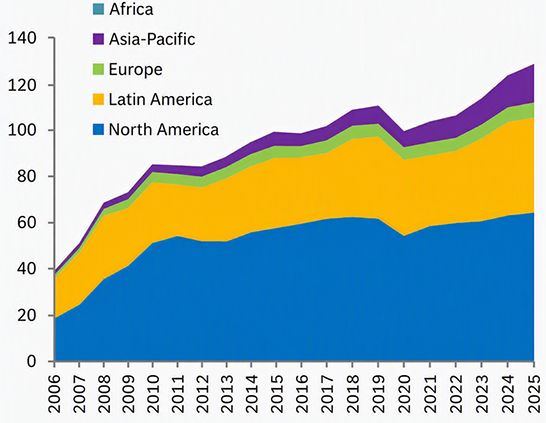
Source: IFPEN, based on S&P Global
The United States remains the world's leading producer, accounting for 50% of the global market, followed by Brazil with 30%. Although production growth was observed across most major producing countries, Brazil experienced a poor sugarcane harvest due to severe droughts and wildfires. As a result, sugarcane was redirected toward sugar production early in the year, and ethanol production increased by only 2% between 2024 and 2025, compared with the double-digit growth rates usually observed. The same growth rate was recorded in North America and Europe, whereas Asia-Pacific maintained growth above 20%.
This strong performance was mainly driven by rapid expansion in India, where the ethanol market doubled between 2023 and 2025 following the early achievement of a target requiring a 20% by volume ethanol blending rate in total gasoline consumption. Indian ethanol production represented nearly 64% of total Asia-Pacific production in 2025.
In Europe, demand for fuel ethanol continues to increase with the growth in sales of gasoline hybrid and plug-in hybrid vehicles. Vehicles powered by gasoline that may contain ethanol now account for more than 70% of new registrations in the European Union.
After the inflationary shock of 2022, easing energy and agricultural costs led to price normalization during 2023 and 2024. A slight increase in prices was nevertheless observed in 2025, particularly in Europe, driven by two main factors: poor grain harvests during the 2024-2025 crop year and a growing carbon premium on ethanol resulting from the progressive tightening of the transport-sector carbon intensity reduction targets established under the RED III Directive.
In Brazil, price increases were directly linked to tighter sugarcane supply conditions as ethanol blending mandates in gasoline were increased. China, on the other hand, remained relatively protected from this trend due to weakness in its domestic corn market and more moderate domestic demand growth.
![Table 1 - Annual ethanol price movements by region [US$/t]](/sites/ifpen.fr/files/inline-images/NEWSROOM/Regards%20économiques/Etudes%20économiques/Biocarburants%202026/EN/Tableau-01_TB-Biocarburants-2026.png)
Source: IFPEN, based on Argus
The United States remains by far the world's leading ethanol exporter, and its position strengthened further in 2025. Export destinations have become more diversified, with Canada remaining a major market, while the Netherlands is playing an increasingly important role as a gateway to the European market. At the same time, Brazil's ethanol exports declined by nearly 15%, mainly as a result of growing domestic consumption.
Diesel Substitutes
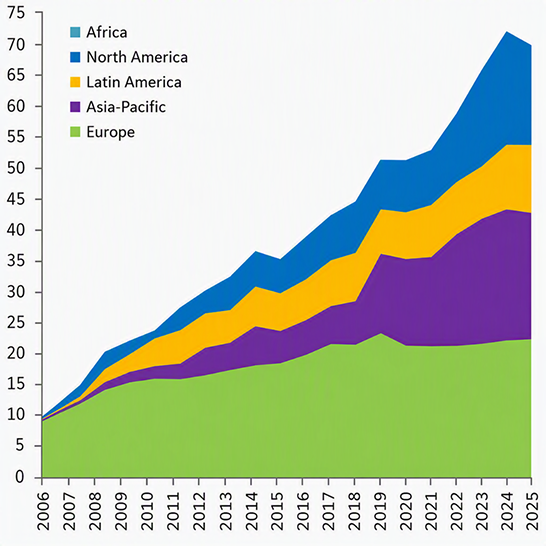
Today, two main biofuels are blended into the diesel fuel pool for road vehicles: FAME biodiesel and HVO renewable diesel. These fuels rely on biomass feedstocks containing fatty acids derived primarily from oilseed crops (rapeseed, palm, soybean, etc.), as well as recycled oils and grease (used cooking oils and animal fats mainly). Unlike FAME, whose incorporation into diesel sold at the pump in the European Union is limited to a maximum of 10% by volume, HVO renewable diesel may be blended without limitation. Although it is a younger industry, HVO has experienced strong growth, accounting for as much as 30% of renewable diesel consumed worldwide in 2024 before declining slightly to 27% in 2025 (Fig. 3).
Historically, the biodiesel market has been dominated by the European Union due to the higher share of diesel-powered vehicles compared with other regions of the world. However, since 2022, the Asia-Pacific region has become the leading producer of bio-based diesel substitutes and confirmed its leadership in 2025 with production reaching 23 billion liters (approximately 18 Mtoe). While the region is also the largest consumer of FAME, almost all of its HVO production is exported.
Indonesia continued expanding its FAME blending mandates through the implementation of B403 in early 2025. Biodiesel is therefore increasingly becoming an energy and agricultural policy tool, rather than merely an export commodity. In China and Singapore, the industry remains largely export-oriented, supported by the deployment of significant new HVO production capacity. Until 2024, these facilities were mainly dedicated to renewable diesel production (2.4 billion liters in Asia). Since 2025, however, they have increasingly shifted toward biokerosene production, discussed later in the aviation section. As a result, renewable diesel production in the region declined to approximately 1.4 billion liters in 2025.
Brazil, the world's second-largest FAME producer (approximately 10 billion liters in 2025), also continued to show strong growth momentum. The country moved to a B14 mandate in 2024 and then to B15 in August 2025. Brazilian soybean-based FAME production is primarily intended for domestic use, unlike other Latin American countries, whose markets remain relatively stable and export-oriented.
In Europe, after several years of stagnation and decline, FAME production reached 12 billion liters in 2025. This recovery was driven in part by stricter European regulations introduced in response to large-scale imports of Chinese biodiesel produced from UCO4 since 2023. Demand remained stable at approximately 13.5 billion liters (10.8 Mtoe). Demand for HVO renewable diesel increased by around 10%, reaching 5 billion liters (nearly 4 Mtoe), while production remained broadly unchanged.
It should also be noted that biodiesel production and consumption in the United States and North America declined substantially in 2025. As the world's leading HVO producer since 2023, U.S. production fell from 18 billion liters to 15 billion liters (12 Mtoe) in 2025. At the same time, FAME production declined by 30%.
This trend resulted mainly from shrinking producer margins caused by high vegetable oil prices, as well as uncertainty regarding pathway eligibility following the repeal of the Blender's Tax Credit, which was replaced by the Clean Fuel Production Credit, a scheme favoring the cleanest pathways and those based on domestic feedstocks
.
Source: IFPEN, based on S&P Global
In export markets, China remains the world's leading exporter of FAME, particularly UCOME5, although Chinese exports fell by a factor of 2.3 between 2023 and 2025 as a consequence of tighter European regulations. While Singapore remained the leading exporter of HVO renewable diesel in 2024, the United States clearly took the lead in 2025, accounting for nearly 47% of global HVO renewable diesel exports.
![Table 2 - Annual FAME biodiesel price movements by region [US$/t]](/sites/ifpen.fr/files/inline-images/NEWSROOM/Regards%20économiques/Etudes%20économiques/Biocarburants%202026/EN/Tableau-02_TB-Biocarburants-2026.png)
Source: IFPEN, based on Argus
![Table 3 - Annual HVO renewable diesel prices in Europe by feedstock class [US$/t]](/sites/ifpen.fr/files/inline-images/NEWSROOM/Regards%20%C3%A9conomiques/Etudes%20%C3%A9conomiques/Biocarburants%202026//EN/Tableau-03_TB-Biocarburants-2026.png)
Source: IFPEN, based on Argus
* Class I: HVO produced from food crops, delivering a minimum greenhouse gas reduction of 65%.
**Class II: HVO produced from recycled vegetable oils (UCO, POME), delivering a minimum greenhouse gas reduction of 85%.
Although the European Union remains the largest importer of FAME, imports were cut in half between 2020 and 2025. HVO renewable diesel, on the other hand, is exported primarily to Canada, while European import volumes remained at levels similar to those recorded in 2022.
Biomethane for NGV Powertrains
Although renewable biomethane remains a minor transport fuel, its consumption continues to rise in regions where natural gas has historically played a significant role in road transport. Biomethane is currently produced mainly through the anaerobic digestion of organic waste and the recovery of landfill gas. Biogas is primarily used for heat and electricity production, while only a small share (approximately 10%) is upgraded into biomethane suitable for injection into natural gas grids and/or use as fuel in dedicated natural gas vehicles.
For transportation, biomethane can be used either as Bio-CNG6, the compressed form of biomethane, or as Bio-LNG7, its liquefied form. Both fuels can fully replace conventional CNG and LNG derived from fossil natural gas without requiring modifications to existing infrastructure. They can be produced either directly at biomethane production facilities or through withdrawal from the gas grid using Guarantees of Origin (GO).
Biomethane motor fuel accounts for only 4% of renewable fuels used in internal combustion engines within the European Union, but it is currently experiencing strong growth (+24% in 2024). Most consumption occurs in the form of Bio-LNG for heavy-duty truck fleets (80%), while maritime transport accounts for a further 17%.
The EU had 16 Bio-LNG production plants at the end of 2021; by the end of 2024, this number had risen to 101 facilities with more than 15 TWh of production capacity. Nearly 50 additional plants are expected by the end of 2028, bringing total capacity to approximately 23 TWh. At present, 16 European countries participate in the Bio-LNG market: Belgium, Denmark, Finland, France, Germany, Italy, Latvia, the Netherlands, Norway, Poland, Portugal, Spain, Sweden, Switzerland, Ukraine and the United Kingdom.
Bio-CNG is primarily used in fleets of heavy-duty vehicles and lighter vehicles and could also become relevant for inland waterway transport in the future. Within the European Union, heavy-duty applications represent the fastest-growing segment.
Globally, however, the market is largely dominated by the United States, which consumes nearly half of all biomethane used in transportation. The U.S. market consists of approximately 90% Bio-CNG and 10% Bio-LNG, with Bio-CNG consumption increasing by 20% between 2024 and 2025. The emergence of the Indian market should also be highlighted, supported by the large-scale GOBARdhan deployment program being implemented from 2026 onwards.
Spotlight on Biofuels in the Aviation Sector
With growing awareness of the environmental impacts of international aviation, which currently accounts for 13% of global transport-related CO₂ emissions, and given the sector’s projected growth, Member States of the International Civil Aviation Organization (ICAO) have adopted several global objectives:
- An immediate objective to stabilize international aviation CO₂ emissions at 85% of the level observed in 2019 through the incorporation of Sustainable Aviation Fuels (SAF) and/or the purchase of certified offset credits.
- A Long-Term Aspirational Goal (LTAG) aimed at achieving net-zero emissions by 2050 without relying on offsets.
- An intermediate objective announced in 2023 to reduce global aviation emissions by 5% by 2030 through the use of clean energy sources.
Between 2024 and 2026, a first implementation phase has been applied in voluntary ICAO Member States. From 2027 onwards, compliance with these objectives becomes mandatory for almost all Member States and international flights.
To achieve these objectives, SAF deployment is considered one of the main levers for reducing aviation emissions. Currently, eight alternative kerosene pathways are certified under ASTM D7566 and three co-processing biokerosene pathways are certified under ASTM D1655. Several routes have already reached, or are close to, commercial maturity, including:
- HEFA-SPK8, produced from HVO facilities
- FT-SPK9, produced through Fischer-Tropsch biomass-to-liquid or e-fuel pathways
- ATJ-SPK10, produced through the conversion of ethanol or isobutanol into synthetic kerosene.
These alternative kerosenes are currently approved for blending at up to 50% by volume with conventional petroleum jet fuel
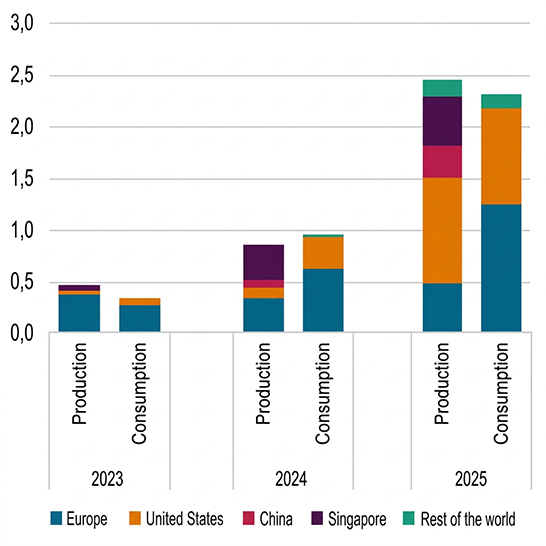
In preparation for the second mandatory phase, ICAO Member States are gradually implementing national SAF deployment policies. In 2025, global SAF production capacity reached 5.8 Mt, mainly dedicated to HEFA-SPK production. During the same year, worldwide SAF production reached 2.6 Mt, more than doubling annually since 2022. The United States was the leading producer (0.79 Mt), while the highest level of incorporation was recorded at European airports (1.2 Mt) (Fig. 6).
Source : S&P Global, August 2026
Through its Sustainable Aviation Fuel Grand Challenge, the U.S. government has set a target of producing 9 Mtoe of SAF by 2030, corresponding to 10% of all jet fuel supplied to U.S. airports. By 2050, the objective is to meet 100% of domestic aviation fuel demand, equivalent to approximately 103 Mtoe. Beyond direct support for production facilities, the primary incentive is a tax credit ("blended fuel credit") indexed to the carbon performance of the fuel.
In the European Union, the ReFuelEU Aviation initiative requires a 2% SAF blending rate in aviation fuel supplied at European airports from 2025, increasing to 6% in 2030 (approximately 3 Mt) and ultimately 70% by 2050. Since 2025, the EASA11 has officially monitored the SAF market within the EU and published its first annual technical report covering 2024. The United Kingdom has also introduced annual SAF mandates whose eligibility depends on carbon intensity. Separate sub-mandates apply to HEFA-SPK pathways and to non-HEFA SAFs and e-SAFs.
In Brazil, a domestic aviation emissions reduction mandate will come into force in 2027, with an initial objective of reducing sectoral CO₂ emissions by 1%, gradually increasing to a 10% reduction target by 2037.
The Asia-Pacific region has established itself as the largest SAF production hub, with 2.6 Mt of production capacity in 2025, representing half of global capacity. China and Singapore are the leading contributors. Although Chinese production is currently export-oriented, the introduction of a domestic blending mandate from 2026 should stimulate local demand. This evolution could tighten the availability of waste-oil-based HEFA-SPK for international markets, particularly Europe. India, Indonesia, Japan, Malaysia and Thailand are also considering national blending mandates over the coming years.
Although several SAF technologies have already been certified and are undergoing industrial deployment, the market remains largely dominated by HEFA-SPK. Since the first international SAF price assessments were published in 2021, prices have experienced significant fluctuations. Regulatory pressure, feedstock constraints and rising energy prices pushed HEFA prices to between US$3,000 and US$3,500/t in 2022. From late 2024 onwards, however, HEFA production capacity expanded significantly, Chinese HEFA-SPK entered the market, and both energy and jet fuel prices declined.
As a result, 2025 prices moved closer to their long-term equilibrium values based on market fundamentals (Table 4).
![Table 4 - Annual HEFA-SPK SAF prices by major production region [US$/t]](/sites/ifpen.fr/files/inline-images/NEWSROOM/Regards%20%C3%A9conomiques/Etudes%20%C3%A9conomiques/Biocarburants%202026/EN/Tableau-04_TB-Biocarburants-2026.png)
Source: IFPEN, based on Argus
**Class II: HEFA-SPK produced from recycled vegetable oils (UCO, POME), enabling at least an 85% reduction in greenhouse gas emissions.
It should be noted that U.S. prices presented in the table are delivered prices benefiting from a tax credit ranging from US$130 to US$650 per tonne of SAF, depending on the fuel’s carbon intensity. This partly explains why U.S. prices in 2025 appear lower than those observed in China and the European Union.
Looking ahead, prices are expected to rise substantially as increasingly stringent national mandates progressively absorb available product volumes and feedstock resources.
Toward the Emergence of Biofuels in Maritime Transport?
Globally, most vessels currently in operation use heavy fuel oil and consume approximately 280 Mtoe of petroleum fuels annually. Beyond the sulfur emissions issue, which has been significantly reduced in recent years, maritime stakeholders have called for alignment with the 1.5°C pathway of the Paris Agreement. Furthermore, onboard technologies capable of using alternative fuels continue to develop. In July 2023, the European Union adopted new legislation under the FuelEU Maritime initiative aiming to reduce greenhouse gas emissions from maritime transport from -2% in 2025 to -80% by 2050, notably through the use of renewable and low-carbon fuels12.
The main alternative fuels currently being considered include:
- Bio-based diesel fuels (FAME, HVO, BtL)
- Methane and Biomethane (LNG and Bio-LNG)
- Bioethanol
- Methanol and Biomethanol
- Ammonia
- Their synthetic e-fuel equivalents (e-diesel, e-methane, e-methanol and e-ammonia)
Electrification and hydrogen are generally considered more suitable for shore-side power supply and inland waterway transport.
Today, fossil LNG remains the dominant alternative to marine fuel oil. At the beginning of 2025, DNV13 estimated the number of LNG-powered vessels in operation at 642, almost double the 2023 figure. LNG bunkering infrastructure is concentrated in Europe, although all continents now possess operational facilities. Bio-LNG remains a niche market but was already available in around 80 ports worldwide in 2023, particularly in Singapore, Rotterdam and along the U.S. East Coast. Rotterdam notably increased Bio-LNG volumes from 1,250 tonnes in 2024 to 7,940 tonnes in 2025, more than sixfold growth.
However, the leading marine biofuel remains biodiesel. In 2024, the ports of Rotterdam and Singapore alone bunkered 1.6 Mt of marine fuels containing between 20% and 30% FAME, mainly in the form of B24 in Singapore and B30 in Rotterdam. Global pure biodiesel consumption in maritime transport is estimated at approximately 1 Mt.
Following the first methanol bunkering operation in Singapore in July 2023, the global fleet of dual-fuel methanol vessels reached approximately 106 ships by the end of 2025, compared with a global fleet of around 116,000 commercial vessels. Several hundred additional vessels were on order. While methanol bunkering volumes in Singapore were estimated at 3,000 tonnes in 2025, Rotterdam recorded the strongest growth. European MRV14 data indicate that 42,000 tonnes of methanol were bunkered in 2024, including 5,000 tonnes of biomethanol. Rotterdam alone reported nearly 12,000 tonnes of biomethanol sales in 2025, compared with around 4,000 tonnes in 2024.
Taken together, Singapore and Rotterdam reported approximately 1.64 Mt of fuels containing a biogenic component in 2024 and approximately 2 Mt in 2025. Biodiesel blended with marine fuel oil dominated in both ports, while Rotterdam incorporated higher shares of biomethanol and Singapore larger quantities of Bio-LNG.
Focus on France
In 2025, France incorporated a total of 3.6 Mtoe of liquid biofuels into fuels distributed nationwide, representing a slight increase (+0.7%) compared with 2024. These biofuels consisted primarily of diesel substitutes (2.4 Mtoe), although the share of FAME declined, followed by gasoline substitutes (1.1 Mtoe), which increased by 17%, and a more recent contribution from biokerosene as a substitute for fossil jet fuel (0.13 Mtoe), which recorded a sharp increase of 80%.
Since 2017, SP95-E1015 containing up to 10% ethanol by volume, has been the most widely consumed fuel by French gasoline vehicle owners, reaching a market share of nearly 61% by the end of 2025. Superethanol E85 (gasoline containing up to 85% ethanol by volume), intended for Flex-Fuel vehicles and gasoline vehicles equipped with conversion kits, experienced a slight decline and represented 5.5% of gasoline consumption, following a record year in 2023. The number of service stations distributing E85 continued to increase, and the fuel is now available at 43% of French filling stations.
Source: Bioéthanol France 2026, based on CPDP data
According to Bioéthanol France, the number of gasoline vehicles equipped with E85 conversion kits reached 259,000 at the end of 2025, compared with 252,000 one year earlier. In addition, the fleet of factory-produced Flex-E85 vehicles increased by 7%, reaching a total of 159,000 vehicles. Gasoline substitutes also include a share of bio-gasoline coming from HVO units that coproduce bio-naphta suitable for use in the chemical industry or in the gasoline pool. This share remains relatively small but continues to grow, accounting for 5.5% of gasoline substitutes in 2025. Since it is not subject to blending limitations, this biofuel currently requires no specific labeling at service stations.
Regarding diesel substitutes, FAME, and in particular VOME16, continue to dominate the market (87%, compared with 13% for HVO renewable diesel). Following strong growth in the renewable diesel market in 2023, market expansion slowed during 2024-2025. The incorporation of FAME into the transport sector was reduced, with approximately 200 kt redirected toward electricity generation in island territories. At the same time, HVO renewable diesel incorporation remained stable as production facilities increasingly shift toward biokerosene production. In 2025, 128,000 tonnes of HEFA-SPK were supplied to French airports, representing almost 2% of all jet fuel distributed in France.
Biofuels in France also include a growing share of biomethane incorporated into NGV fuel. Bio-NGV is primarily consumed as Bio-CNG in road transport. In 2025, consumption reached 260 ktoe, meaning the market doubled within two years. Due to the sustained increase in fossil natural gas prices, the share of fossil CNG declined, while Bio-CNG accounted for a majority share of total CNG consumption at 67%. Out of more than 39,000 NGV vehicles capable of running on biomethane in 2025, approximately 26,000 were heavy-duty vehicles (trucks, buses, coaches and garbage trucks). This segment grew by 11% between 2024 and 2025, with heavy trucks alone increasing by 14%.
Outlook for Carbon Neutrality by 2050
As carbon-neutrality commitments continue to be adopted worldwide, decarbonization solutions for emissions-intensive sectors are expected to expand and diversify. In the transport sector, the main technological pathways include electrification, natural gas, hydrogen, biofuels and e-fuels. Since each solution has its own limitations, most long-term energy scenarios foresee the deployment of all these options, including biofuels, to varying degrees.
• Global Biofuel Market Evolution in IEA World Energy Outlook Scenarios
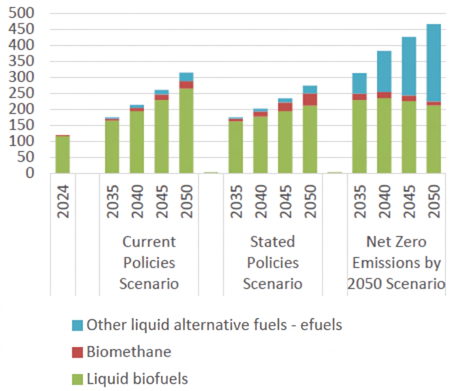
The International Energy Agency's World Energy Outlook 2025 (WEO 2025) presents three scenarios extending to 2050 (CPS, SPS, NZE, see Fig.8). Among them, only the Net Zero Emissions by 2050 (NZE) scenario achieves carbon-neutrality objectives in participating countries. Nevertheless, all three scenarios project further growth in the global biofuels market.
By 2050, biofuel consumption ranges from a minimum of 224 Mtoe (approximately double today's market) to a maximum of 288 Mtoe (Fig. 8). When e-fuels, which may also rely on biogenic carbon feedstocks, are included, the market expands beyond 450 Mtoe in the most ambitious NZE scenario.
While the Current Policies Scenario (CPS) and Stated Policies Scenario (STEPS) still project significant consumption of fossil fuels in 2050, with alternative fuels representing around 10% of the fuel mix, the NZE scenario raises the share of alternative fuels to nearly 62% by 2050, including approximately 30% biofuels.
Source: IFPEN based on IEA, WEO 2025
• Evolution of the French Biofuel Market in the SNBC 3 Pathway
France's new National Low-Carbon Strategy (SNBC 3) was published in July 2026. The strategy is the result of a planning exercise initiated in 2021 and designed to establish a national reference energy and climate scenario based on modelling work developed jointly with stakeholders. SNBC 3 mobilizes all emissions-generating sectors of the French economy to guide the transition from a country emitting 508 MtCO₂eq in 1990 to a carbon-neutral economy by 2050.
Transport remains the leading greenhouse gas emitting sector in France, accounting for 34% of total national emissions. The objective of SNBC 3 is to reduce emissions by 26% by 2030 relative to 1990 levels and to achieve near-zero emissions by 2050, with only residual aviation emissions remaining.
In support of this objective, the following trajectory outlines expected biofuel production and consumption trends through 2050. Starting from a current incorporation level of 3.6 Mtoe, biofuel consumption is projected to increase to: 6.3 Mtoe in 2035, 6.7 Mtoe in 2040, and 5.8 Mtoe in 2050.
Demand growth through 2040 is mainly driven by domestic transport, international transport and agriculture. Beyond 2040, declining overall energy demand and increasing electrification reduce demand for biofuels in domestic transport, while their use continues to grow in international aviation and maritime transport.
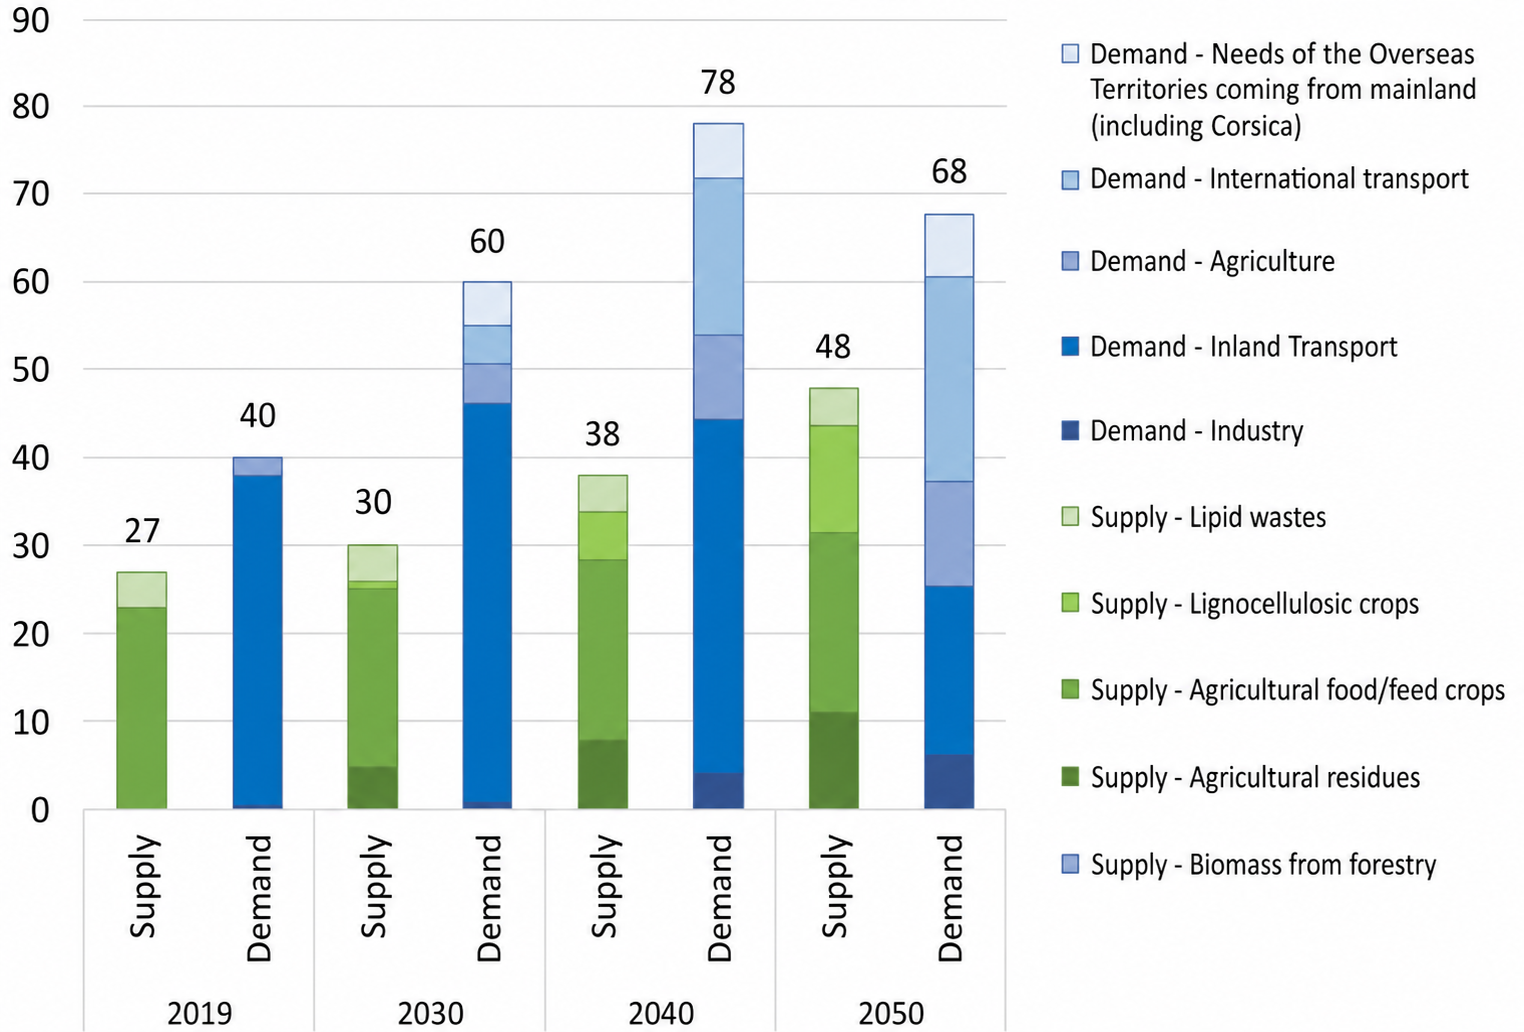
Source: SNBC3 Annex; Metropolitan France and Corsica perimeter; TWh LHV
On the supply side, the scenario assumes that import dependence may increase between 2030 and 2040 before returning to a level similar to today's situation by 2050, around 1.7 Mtoe. This pathway therefore requires the development of supply chains based on agricultural residues and non-food lignocellulosic crops. Preparation for this transition should begin immediately through the ongoing industrial deployment of advanced biofuels such as cellulosic ethanol and Biomass-to-Liquids pathways.
Download the Biofuels Dashboard 2026 (PDF - 1.8 Mo)
Daphné LORNE - Economics & Technology Intelligence Department, IFPEN
[1] LPG: Liquefied Petroleum Gas
[2] NGV: Natural Gas for Vehicles
[3] B40: Road diesel made up of 40% FAME by volume
[4] UCO : Used Cooking Oil
[5] UCOME : Used Cooking Oil Methyl Ester
[6] CNG: Compressed Natural Gas
[7] LNG: Liquefied Natural Gas
[8] HEFA-SPK: Hydroprocessed Esters and Fatty Acids – Synthetic Paraffinic Kerosene
[9] FT-SPK: Fischer-Tropsch – Synthetic Paraffinic Kerosene
[10] ATJ-SPK: Alcohol-to-Jet – Synthetic Paraffinic Kerosene
[11] EASA: European Union Aviation Safety Agency
[12] https://data.consilium.europa.eu/doc/document/PE-26-2023-INIT/fr/pdf
[13] DNV: Det Norske Veritas, a Norwegian international organization specializing in certification and risk assessment, particularly in the maritime sector.
[14] MRV: Maritime Monitoring, Reporting and Verification Regulation
[15] SP95-E10: Unleaded 95 gasoline containing up to 10% bioethanol by volume
[16] VOME: Vegetable Oil Methyl Ester
You may also be interested in