

19.03.2019
30 minutes of reading


Gas markets continued to grow in 2018, driven by abundant supply and the substitution of coal by gas in major consuming countries. This occurred against a backdrop of growing global energy demand, driven by the dynamism of emerging markets, led by China and India. LNG is a driving force in the expansion of gas markets and is expected to continue to grow strongly in the future.
Growth in gas consumption remains strong in 2018
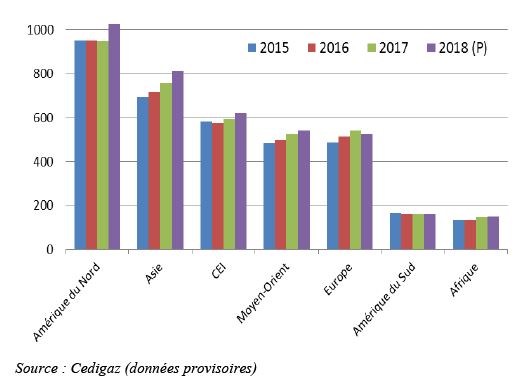
Natural gas is now a major contributor to the growth of global energy demand, while renewable energies are rapidly advancing in the electricity mix. As part of the global increase in primary energy, there has been an acceleration in demand for natural gas since 2017. By 2017, global gas demand had jumped 3.5% to 3,667 billion m3. In 2018, according to Cedigaz, demand probably increased even more strongly. As a result, gas is strengthening its position in the energy mix. This trend is largely due to abundant available supply and energy policies (proactive in favor of gas) in some major consuming countries, particularly China.
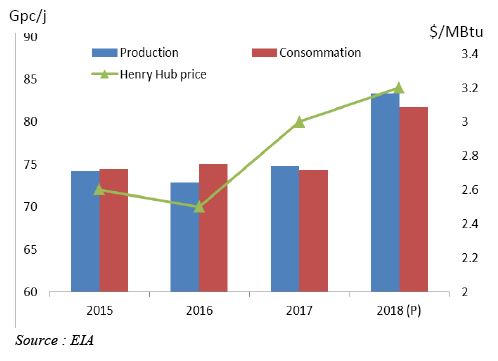
In 2018, the United States experienced exceptional growth in both its production and consumption of natural gas. Preliminary EIA data show an annual increase of 70 billion m3 in consumption and 80 billion m3 in production. No other country in the history of the gas industry has performed so well. The rebound in US consumption is largely due to extreme winter and summer weather conditions that impacted consumption in the electricity and residential sectors. In addition, economic dynamism has been accompanied by a revival in industrial activity. Natural gas has gained ground over coal in the power mix, thanks to the low cost of producing shale gas. The share of gas in electricity production is expected to increase from 32% in 2017 to 35% in 2018, while the share of coal is expected to decrease from 30% to 28%. Electricity capacity under construction is mainly composed of gas and renewables, while many coal-fired power plants are in the process of closing.
The ramp-up in US production was supported by shale gas and oil-associated gas (Texas, Oklahoma), which is highly responsive to changes in crude oil prices. The development of transport infrastructure in the northeast region promotes the marketing of shale gas (Marcellus and Utica fields) and contributes to increasing producers' profits. Economically recoverable gas reserves at the current price of $3/MBtu have increased significantly in recent years.
In Asia, gas demand has continued to grow strongly under the impetus of China, which alone accounted for about 70% of regional growth in 2018. Since 2017, Chinese gas demand has accelerated in all consumption sectors. It is expected to increase by 17% in 2018 (+15% in 2017). It is very likely that consumption will continue to grow in double digits over the 2019-2020 period. This trend is the result of increased government action against pollution, resulting in a shift from coal to gas in all sectors. For China, it would result in a gas electrical capacity of 110 GW in 2020.
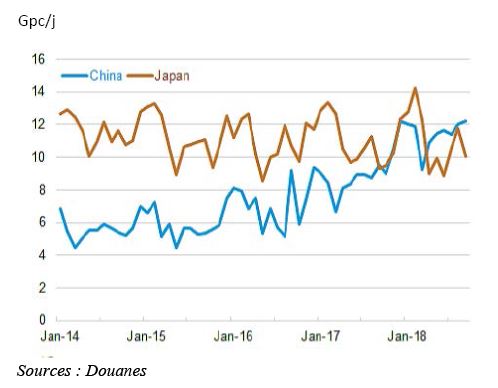
Domestic gas production grew strongly but at a slower pace than demand. As a result, China must import massive and growing quantities on the international market. Import volumes increased by 32% to 125 billion m3 in 2018, double the level of 2014. China has overtaken Japan to become the leading importing country. It thus increasingly influences global gas market conditions and market price trends.
India is also playing an increasing role in the international market. Its gas consumption has grown rapidly since 2016, in the context of a shift in national energy policy towards gas, including the launch of reforms on domestic prices as well as on the investment regime. The Indian government's energy plan aims to accelerate the transition to a new gas-based economy. Among the main objectives is to complete the distribution network throughout the country to reach 70% of the population. The recent expansion of Indian gas demand is therefore driven by city gas (gas served by the distribution network), which covers residential, transport (NGV) and part of the industry. This sector is a priority in the national gas allocation policy and its consumption is less elastic to variations in the prices of the various energies, unlike the electricity sector. In 2018, gas consumption in India is expected to increase by 5% (+3% in 2017). This growth is expected to continue in the coming years. As a result, India, which now imports half of the gas it consumes, is entering the international LNG market more significantly.
(billion m³)
The LNG market is booming in a period of major transformation
LNG is a key growth driver for the gas industry. The share of LNG in gas supply is increasing from 10% in 2017 to 11% in 2018 (9% in 2015). The expansion of the LNG market is accompanied by an increase in supply routes and the arrival of new import markets (Panama and Bangladesh in 2018). Arbitrage transactions are intensifying in a market that is becoming more liquid and flexible.
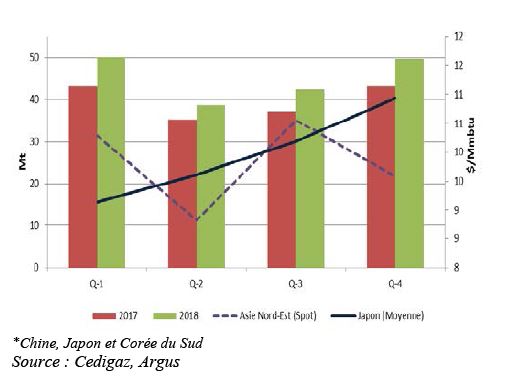
In 2018, international LNG flows represented a provisional estimated volume of 311 Mt (source: Cedigaz), up 8.5% compared to 2017. LNG now accounts for one third of gas exchanges. As in 2017, growth in LNG imports was concentrated in northeast Asia (China and South Korea), where gas plays an increased role in power generation and heating. China is the largest contributor to the growth in global LNG demand, accounting for more than 60% of the total increase in trade.
LNG supply is diversifying and intensifying. Australia recorded the strongest growth in LNG exports in 2018. In November 2018, Australia became the world's largest LNG exporter for the first time, overtaking Qatar. Two major export projects have recently been launched, Ichthys and Prelude FLNG. The latter is the largest floating offshore installation ever built in the world.
US LNG exports increased to 20 Mt in 2018, a 55% increase over 2017, thanks to the ramp-up of recent plants and the arrival of new projects (Dominicon Cove Point Train 1, Corpus Christi Train 1). US LNG exports did not go massively to Europe but to Asia, where profit margins were higher. LNG export capacity could double to 56 Mt/y by the end of 2019, making the United States the third largest LNG exporting country after Australia and Qatar.
One of the key developments in the LNG industry is also the ramp-up of exports from Yamal LNG's Russian project (Novatek joint venture 50.1% - Total 20% - CNPC 20% - SRP 9.9%), which commissioned two additional liquefaction trains in 2018 earlier than expected.

At the end of 2018, a surplus of LNG had formed in Asia, leading to a redirection of cargoes to Europe, a market of last resort. Europe's role, thanks in particular to the presence of a large storage capacity and the possibility of re-exports and transhipments, has become central to the rebalancing of the global market. In 2018, European LNG imports reached their highest level since 2012.
Compared to 2017, LNG market fundamentals improved and the perception of undersupply risk due to strong demand growth was higher within the industry. It is against this backdrop that liquefaction projects have been rapidly advancing in all regions of the world. After three disappointing years of investment, three projects were approved in 2018: the expansion phase of the Corpus Christi plant in the United States (+4.5 Mtpa), LNG Canada in British Columbia (+14 Mtpa), which is the largest project financed since 2013, and the floating facility at Grand Tortue Ahmeyim (+2.5 Mtpa) off Senegal and Mauritania.
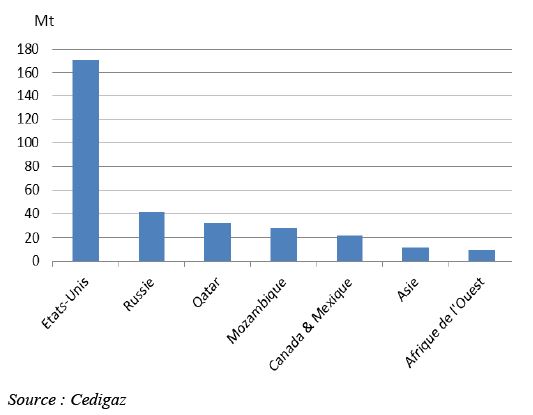
However, gas investments remained insufficient in 2018 and the LNG industry is key to boosting these investments in the future. There are now a very large number of liquefaction projects awaiting a final investment decision (FID). As shown in Figure 5, the majority of these projects are located in the United States. It is also worth noting the significant increase in capacity planned in Qatar. In addition, the deployment of new liquefaction projects around the world will expand the club of exporting countries (Mozambique, Canada, etc.).
The LNG industry continues to evolve in order to become more agile and responsive in an increasingly competitive international environment. About one third of global LNG transactions are currently outside traditional long-term contracts. LNG Canada is the first major project that is not backed by long-term supply contracts. LNG exchanges indexed to spot prices are gaining importance in Asia, where the JKM index is gradually becoming a benchmark.
In addition, recent contracts no longer have a destination clause. More than 80% of the total liquefaction capacity awaiting a FID is delivered in so-called flexible deliveries. By 2020, it is estimated that flexible trade will account for nearly half of the total LNG supply.
More projects are now financed entirely by equity, often involving large companies and "aggregators" managing a portfolio of LNG sources and destinations. In the event of limited access to capital, new financing structures are developed, involving various players including trading companies. These developments aim to better distribute risks and benefits across the entire value chain.
These developments are very positive for the future of the LNG market. They show that the industry will be able to offer adapted and diversified solutions to customers in a context of strong growth in demand. As a result, the industry is now better positioned to avoid a supply crisis in the next decade.
A context of increased market volatility and uncertainty
The increase in gas prices in 2018 is part of a general context of rising prices for all fossil fuels. However, spot gas prices were less correlated than before with oil prices in 2018. Extreme weather conditions and changing LNG market conditions have contributed to greater market price volatility. In the United Kingdom, the NBP spot price reached a historic high of $32/MBtu on 1 March 2018. In the United States, the Henry Hub price soared to levels close to $5/MBtu in January and November, averaging $3.2/MBtu annually.
In 2018, the global LNG market was relatively tight and the long-awaited LNG bubble did not materialize. LNG supply growth in 2018 was less than expected due to delays in the start-up of some liquefaction projects.
The LNG market is increasingly dictating market prices. The dynamism of the Asian market, and more particularly China, has caused tensions on the international market and has caused upward pressure on prices. The summer period, which was warmer than normal, saw Asian spot prices soar to levels above $10/MBtu, while they fell back to $9/MBtu at the end of the year. Contrary to the usual pattern of the gas market, the summer period was more tense than the winter period. These tensions have revealed the need to invest in new export projects.
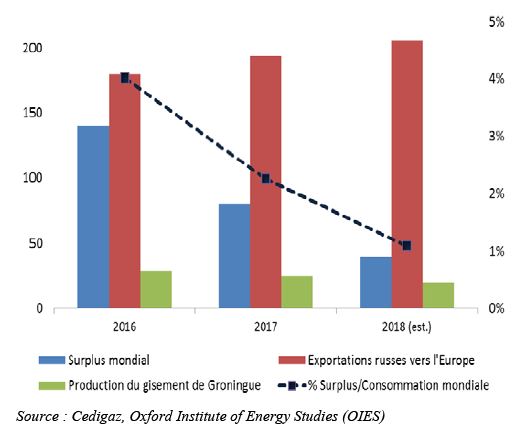
The European market is increasingly dependent on LNG market conditions. Its import requirements are only increasing as domestic production declines as a result of the rapid decline in production from the Groningen field and the decline in mature fields in the North Sea. Russia benefited again from this situation in 2018, relying on an abundant and competitive gas supply. Gazprom's pipeline exports to Europe reached a new record in 2018 (201 billion m3 according to first official announcements). In addition, Europe was able to complete its purchases of Gazprom with LNG from the Yamal LNG plant. Thanks to LNG, Russia is gaining a 36% share of the European market in 2018 (33% in 2017), corresponding to a delivery to Europe of around 205 billion m3 of gas in 2018.
It is important to note that gas consumption in Russia has increased significantly over the past three years. It has become very volatile with significant peaks sometimes observed in winter.
As a result of all these developments, the world gas surplus (difference between production capacity and actual production), which is concentrated in Russia, has been significantly reduced over the past two years.
As a result, gas markets may be subject to varying degrees of stress at any time in an environment of risk and uncertainty: market risks, impact of the trade war between China and the United States, slowdown of the Chinese economy and risk of global recession, US sanctions, Russian-Ukrainian conflict and increased risk of supply disruptions, etc. Against this backdrop, price forecasting scenarios are uncertain, although the increase in US LNG exports in 2019 is likely to reduce international market tensions, at least in the short term.
What place for gas in the European energy mix?
In 2018, strong growth in gas supply and demand was widespread in all major consuming regions except Europe. Indeed, the growth of European gas consumption came to a halt in 2018, after three years of rising consumption. The decline in consumption was particularly significant in Germany (-7%) and France (-5%).
The increase in the power of renewables, including hydropower (Italy, Spain), is the main explanatory factor. The increase in nuclear electricity production in France is also an element to be taken into consideration.
In some countries such as the United Kingdom, the growth of renewables is such that it reduces the share of all fossil fuels in the electricity mix, including gas (Fig. 8). It changes the way gas-fired power plants operate from a basic regime to a semi-basic or peak regime, which is accompanied by a drastic drop in gas demand.
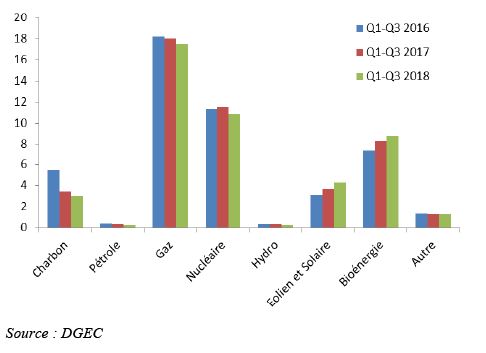
In the United Kingdom, the electrical capacity of renewables even exceeded that of fossil fuels in the third quarter of 2018.
In November 2018, the European Parliament and the European Council adopted three texts of the "Clean Energy for All Europeans" package. Several binding targets will be set by 2030: 32% renewable energy in the energy mix and 32.5% energy efficiency gains. The role of natural gas in passing the electric peak is recognized by the European Commission. One of the challenges of the 4th package is to green the gas in a decarbonation process. In the case of transport, at least 14% of transport fuel must come from renewable sources by 2030 (REDII Directive), and this includes 3.5% advanced biofuels including biomethane. In addition, in November 2018, the European executive presented its strategy for carbon neutrality by 2050, in accordance with one of the main objectives of the Paris Agreement. In all the scenarios studied, the use of fossil gas decreases significantly in favor of renewable gas.
The development of renewable gas
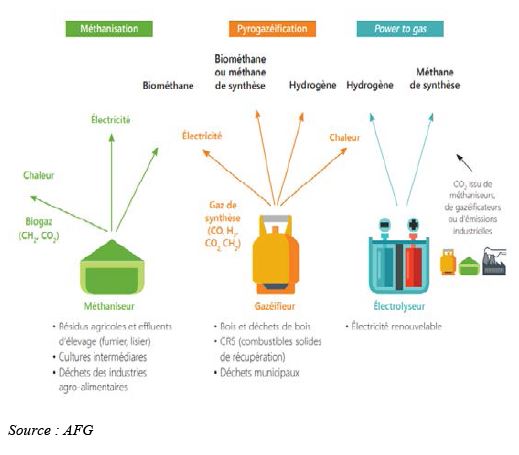
The production of renewable gas can be achieved by the methanization of biomass or waste, or by the hydrogen methanation process in the presence of CO2. Hydrogen can be produced by biomass gasification or water electrolysis (Power to Gas process)2.
Biomethane has environmental benefits (reduction of GHG emissions compared to the use of fossil gas, in particular as a substitute for diesel in transport) but also economic and strategic benefits (reduction of energy dependence and the cost of gas imports, support for other policies related in particular to agriculture, etc.). Access to the gas network allows you to benefit from the large storage capacities and gas infrastructures. Renewable gas is therefore essential for the optimal use of gas infrastructure in a decarbonation context.
The European energy scenarios of the various institutions now include the development of biomethane as one of the relevant levers for decarbonation.
At present, biomethane production worldwide is relatively marginal and concentrated in Europe (2 billion m3 in 2017). Energy crops still represent the most important source of inputs in Europe today, mainly due to widespread use in Germany, which is by far the largest producer of biogas and biomethane in the region. Organic and agricultural waste is the second source of substrate. France and Denmark are focusing on the recovery of agricultural waste, while most other countries in Europe favor organic waste (household or industrial). In the longer term, the gasification of biomass from lignocellulosic resources is also being considered. The maximum technical potential for biogas production in Europe (used as biogas or transformed into biomethane) is estimated at about 150 billion m3/year (natural gas equivalent), including about 100 billion m3/year from biomass (including lignocellulosic biomass) and 50 billion m3 from energy crops (low estimate)3.
Taking into account economic constraints greatly reduces this potential. The cost of producing biogas varies according to the methanized products and the size of the installations. It is in a range between €30 and €150/MWh4 (about €90/MWh in France), while the current wholesale price of gas is €22/MWh. Assuming the maintenance of a proactive European policy to support ENR sectors, a widespread introduction within the EU of effective public support mechanisms, but also technological improvements (learning effects), biogas production could reach a maximum of 50 billion m3 in 2030, which represents one third of the technical potential5. In order to make biogas purification profitable (taking into account the minimum installation threshold size, other uses of biogas, etc.), it is estimated that 40% of the biogas produced is biomethane. We deduce from this a renewable gas production of about 20 billion m3 in 2030 (including bioGNV).
Given the constraints of availability of methanisable resources, the development of renewable gas from methanation is essential to achieve greater potential and support the development of the sector in the long term. Today, the biomass gasification and Power to Gas processes are technologically known but remain at the demonstration stage. These techniques face economic challenges and it is necessary to increase R&D efforts and experiments to make them less expensive. Economic uncertainties regarding Power to Gas technology are high. The current costs of methanation are in the range of €150 to 300/MWh. Even assuming a very significant cost reduction factor in a long-term perspective (factor 3), this solution will hardly remain competitive with natural gas.
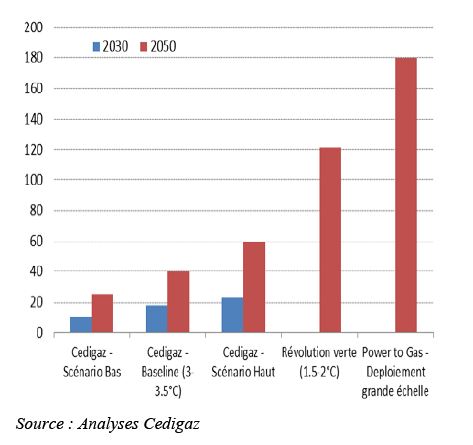
The future expansion of renewable gas will therefore inevitably depend on the public financial mechanisms put in place to support the sector. According to Cedigaz, biomethane production in Europe could reach a volume of between 25 billion m3 and 60 billion m3 in 2050, which represents 5% to 13% of current European fossil gas consumption and 20% to 45% of production, which is not insignificant. The most proactive "low-carbon" scenarios (trajectory of 1.5-2°C) in favor of renewable gas show a volume of about 120 billion m3 in 2050. In the case of a massive and large-scale deployment scenario of Power to Gas technology, renewable gas production can reach up to 180 billion m3 in 2050. In any case, renewable gas can only replace part of the fossil gas consumption.
It should be noted that biomethane is rapidly expanding in France, a country that is one of the key national markets in the sector. The Multi-Year Energy Program (PPE) bill published in January 2019 set a 7% share of biogas consumption in 2030 for biogas "if the cost reductions targeted in the reference trajectory are achieved" (on average, €67/MWh in 2023 and €60/MWh in 2028) "and up to 10% in case of a higher cost reduction".
As of 1 July 2018, 59 sites were injecting biomethane into France and capacity reservations amounted to more than 8 TWh cumulative at the end of 2017, equivalent to the biomethane injection target set by the Multi-Year Energy Program (PPE) for 2023. Three Power to Gas demonstrators currently exist in France. Based on the 2017 multi-year gas forecast balance (Source: GRDF), a share of between 6% and 34% of renewable gas injected into the networks is envisaged by 2035. This represents volumes between 20 and 140 TWh6.
Conclusion
Natural gas is attracting increasing interest from governments for strategic, economic and/or environmental reasons. This energy is increasingly being used as a substitute for coal and oil in all consumer sectors, particularly in China and India. The United States, which has a very abundant supply at competitive prices, will make a major contribution to supplying the world market in the coming years, under the watchful eye of Russia, which is also seeking to consolidate its market share beyond the European market.
Renewable energies are booming as part of the transition to a low-carbon energy mix, but natural gas also has a key role to play in this transition. In 2018, carbon emissions are expected to increase sharply again, reflecting the ever-increasing consumption of the most polluting fossil fuels, such as oil and coal. Indeed, coal-fired power generation continued to grow strongly in emerging Asia. In these coalmining countries, the use of gas as transition fuel therefore makes sense and the impact of government measures to accelerate this transition is major. In Europe, the parameters of the transition phase are different because the electricity mix is already much less carbon-intensive. Gas is increasingly considered as an alternative to coal, but this role is of a transitional nature. The use of fossil gas is expected to be reduced significantly to make way for renewable gas. Biomethane is an emerging but promising field.
armelle.lecarpentier@ifpen.fr - rao.amit@ifpen.fr
Draft submitted in February 2019
(1) Conversions used: 1 m3 = 0.097 cf/d = 0.00075 tonne of LNG
(2) Biomethane in France: the impacts – IFPEN - Panorama 2018
(3) Biomethane Trade Workshop, Brussels, 21 February 2012
(4) Biogas in Europe: the outlook – IFPEN - Panorama 2018
(5) Green Gas Grids project (2014), European Commission, Cedigaz
(6) Assuming that consumption stabilizes between 2028 and 2035