31.03.2021
6 minutes of reading


Public decision-makers currently lack tools to evaluate the impact of road traffic on air quality and make informed decisions to reduce pollutant emissions. IFPEN’s teams have developed a tool that, using data provided by connected vehicles (Floating Car Data or FCD), makes it possible to assess the pollution emitted by characteristic driving behaviors and, ultimately, produce a detailed map of vehicle pollutant emissions for different sections of a region’s road network.
When emissions and accelerations go hand in hand
Vehicle pollutant emissions obviously depend on powertrain technologies but they also depend on driving conditions, which themselves are intrinsically related to driving style, road infrastructure and traffic regulation. These conditions thus represent levers for action for public decision-makers but the latter do not currently have access to effective tools to assess the real impact of road traffic on air quality.
An accurate evaluation of vehicle emissions requires a reliable estimate of the impact of driving conditions on engine operating points, which depend on vehicle’s characteristics as well as accelerations and road slope.
Driving behavior can be learned
The roll-out of connected vehicles capable of providing data acquired in motion (Floating Car Data or FCD) makes it possible to learn about the real driving behavior in different traffic conditions according to the layout of the road infrastructure. Today, this information can be readily accessed thanks to geographic information systems (GIS).
Teams from IFPEN thus proposed a method for learning dynamic driving behavior [1] (consideration of accelerations) making it possible to associate statistically representative speed profiles with different realistic driving situations, as impacted by the infrastructure, congestion and traffic regulation measures. The model illustrated in Figure 1 is based on machine learning tools and, more specifically, on combinations of supervised (e.g. neural networks and random forests1) and unsupervised (clustering2) learning techniques, in order to reproduce typical behaviors of drivers in a variety of real-life driving situations.
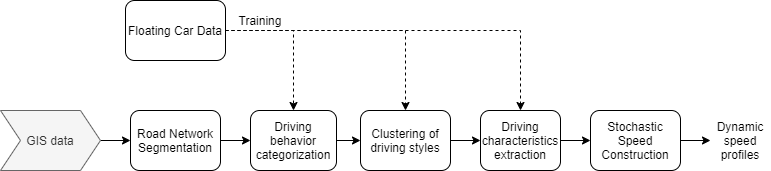
A Markov process3 is then used to generate driving profiles with a variability that is statistically representative of the driving style, as observed in FCD.
Pollutant emission formation under the microscope
The generated speed profiles are evaluated using a pollutant emission model developed by IFPEN drawing on its testing resources and expertise in the field of engine and pollution control system characterization. A complete modeling chain validated step by step thus makes it possible to describe phenomena ranging from driving, through to combustion and pollutants emitted into the environment (Figure 2).
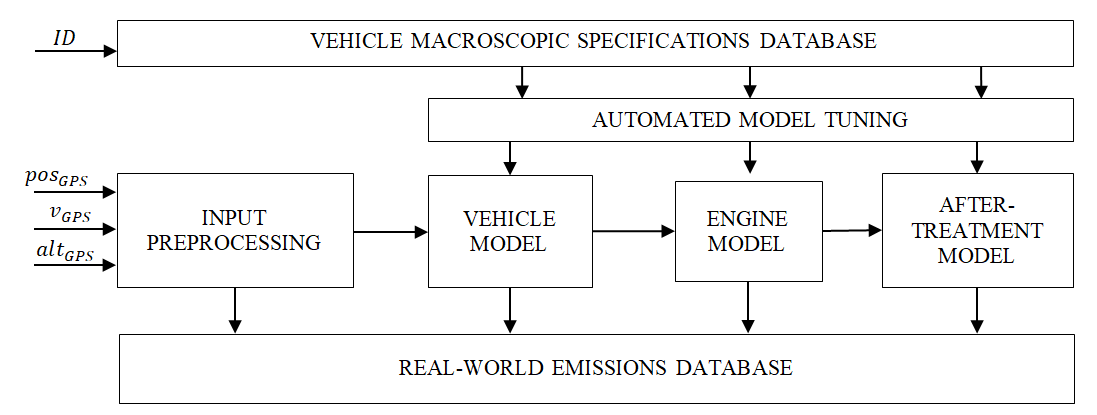
The modeling approach proposed in this research is aimed at finding a compromise between accuracy and the simplicity of mathematical expression required for the speed of computation. 0D models are thus used with thermal and fluid mechanics phenomena characterized by first-order systems.
Lastly, the incorporation of any type of powertrain and post-treatment technology, particularly Diesel Oxidation Catalyst (DOC), Diesel Particulate Filter (DPF), Selective Catalytic Reduction (SCR), Lean NOx Trap (LNT) and Three-Way Catalyst (TWC), enables the adoption of the model in any geographic zone and irrespective of the vehicle fleet.
Pollutant emissions on the map
The final step of the method consists in mapping vehicle pollutant emissions on each road segment. The objective is to provide public authorities, towns and cities with an accurate tool for monitoring and visualizing road traffic emissions in order to effectively identify the road layouts and traffic conditions that have the greatest impact on local air quality [2]. Comparison with traditional state-of-the-art tools demonstrates significant improvements in terms of pollutant emission map accuracy and time and space resolution (Figure 3).
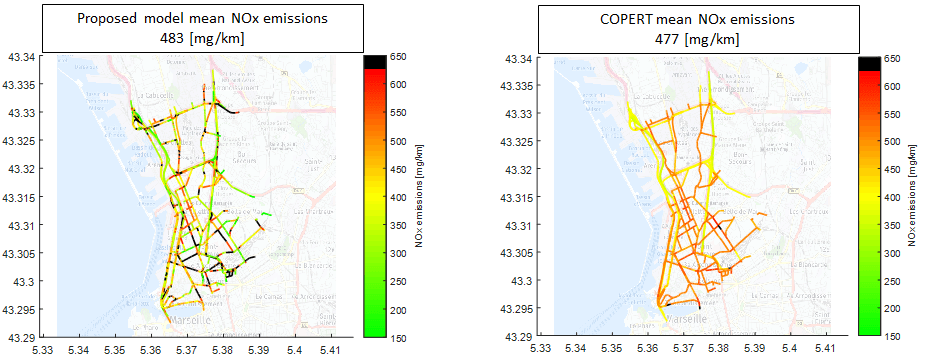
The increased roll-out of connected vehicles, acting as mobile sensors, will optimize the efficiency of the proposed approach for the high-resolution characterization of the road traffic pollutant footprint.
1 The random forest or random decision forest algorithm is a classification algorithm that reduces the variance of forecasts from a single decision tree, thereby improving performances. The algorithm conducts parallel learning on multiple decision trees built randomly and trained on subsets of different data.
2 Clustering is a data analysis method aimed at dividing up a set of data into different “homogeneous” subsets, in the sense that their data share common characteristics.
3 Stochastic process that verifies two conditions:
- the state at time t of the process is only dependent on the state at time t − 1
- the probability of moving from a state i to a state j does not vary over time
The developments described here draw on the expertise of IFPEN’s Digital Science and Technology Division in the fields of data analysis and processing and complex system modeling. The methodology explored in this research has has provided food in the context of several fundamental research projects, within the framework of the “scientific challenges” approach: Massive data flows (SC4) and Command and optimization (SC7). In particular, a thesis currently under way relates to the “prediction of speed profiles from the architecture of a road network, via deep learning approaches”: it will make current data more representative in order to consolidate the maps of pollutant emission, safety and energy consumption, etc.
References
[1] M. Laraki, G. De Nunzio, L. Thibault, “Vehicle speed trajectory estimation using road traffic and infrastructure information”, IEEE 23rd International Conference on Intelligent Transportation Systems (ITSC), 2020.
[2] G. De Nunzio, M. Laraki, L. Thibault, “Road Traffic Dynamic Pollutant Emissions Estimation: From Macroscopic Road Information to Microscopic Environmental Impact”, Atmosphere, 12, 53, 2021.
Scientific contacts: Giovanni De Nunzio, Mohamed Laraki, Laurent Thibault
You may also be interested in