01.07.2018
30 minutes of reading


The role of technology often features amidst the dynamics of the energy transition, but much uncertainty remains about the widespread dissemination of low-carbon innovations. Cost, the speed of adoption and acceptance of technologies are basic parameters for carbon emission reduction, along with their impact on resources. Lithium is a testing ground to analyze dependence on materials in vehicle electrification scenarios on a global scale.
With more than three million electric cars (EV)1 in circulation, of which nearly 40% are in China, and 56% growth compared with 2016, 2017 continued the trend towards electrification that has existed since 20102. Though electric vehicles make up less than 1% of the global fleet, commitment by manufacturers3 and governments to promote their development suggests huge potential for electrification in the coming years. In many regions around the world, electrification in the transport sector has become a priority in order to meet national climate targets and address local pollution issues. Questions about access and dependence on natural energy resources were key elements in the implementation of energy policies in various countries during the last century, especially in Europe and the United States. However, current dynamics in the renewable energies sector (ENR) are the source of new uncertainties about the availability of some mineral resources. Lithium, a strategic metal used in battery production, is fairly representative of these new challenges and provides an ideal testing ground to analyze dependence on materials across a range of global energy transition scenarios.
Energy transition: from strategic materials to critical materials
Whether for the electric vehicle sector4, catalyzers or fuel cells5, in the wind sector6, civil aviation7 or photovoltaic solar power8, all innovations developed for the purpose of reducing carbon emissions are, in the end, dependent on the availability of minerals and refined metals. However, most of these markets are small compared with the non-ferrous metals market9; they are weakly organized, lack transparency and most transactions are always made by mutual agreement, without the support of financial market structures such as the London Metal Exchange (LME). In addition, some of these metals are by-products of mining activities: consequently, their extraction and production are geologically and economically dependent on the production of other metals. Lastly, the location of resources and the strategies of key players (industry structure, trade and investment policy, etc.) can make the use of a raw material critical: the widespread distribution of technologies relying on such materials could create, and even exacerbate, tensions within the markets for these metals.
In general, the European Commission (EC) defines a critical raw material as one with high strategic importance,10 with a high risk of disruption to supply. Chemical elements have been thus classified by the EC in reports published in 2011 and 2014 (EC, 2011; EC, 2014)11 and some of them deemed to be critical. Updated in 2017 (EC, 2017)12, this study now lists 27 elements considered critical, compared with 20 in 2014. The notion of criticality is therefore dynamic and specific. It changes over time as technologies develop, but is also specific to each economic sector and individual stakeholder (companies, government, etc.) depending on the strategic importance of its use13. It also highlights the challenge of developing a comprehensive understanding of all risks related to the issue of raw materials in the energy transition. The risks are many: geopolitical risk (case of rare earths, a large proportion of which are concentrated in the hands of several players), economic risk (embargo, preferential policies for certain players, trade retaliation, market manipulation, etc.), risks related to production (under-investment, joint production, etc.) and environmental and social risk (emission of pollutants linked to production, health effects, destruction of the landscape, etc.) (Fig. 1).
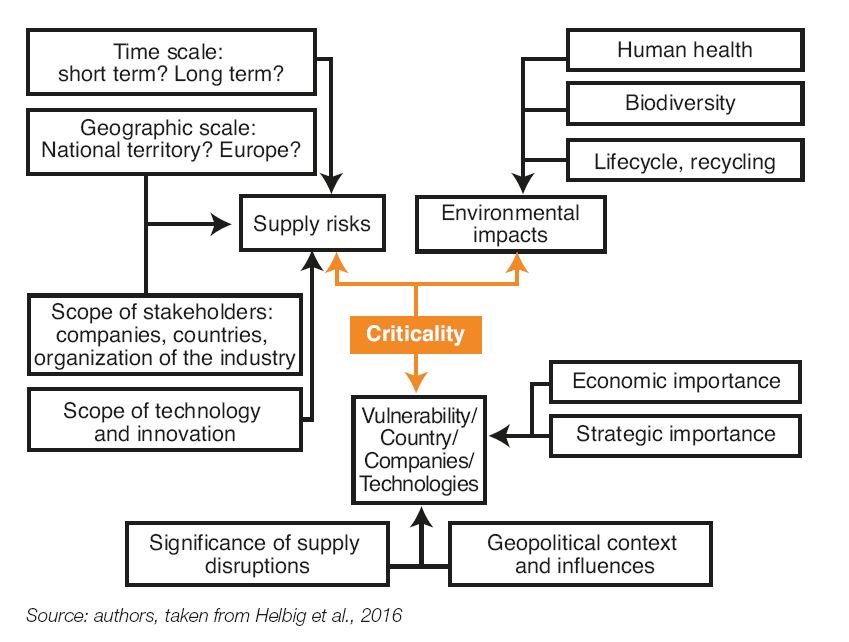
Graedel et al. (2012), then Helbig et al. (2016), summarized, for a metal, the notion of criticality as follows: it is used in numerous industrial sectors; it is difficult to find, in the short-term, an adequate substitute for one or more industrial applications; the number of industrial applications using it is broad and increasing over time; it is employed for dispersive uses with limited recycling potential; it has a high economic value; its production and reserves14 are geographically concentrated. This definition must also include the environmental impact of mining and refining activities, which is substantial for large-scale production.
With an oligopolistic industrial market and reserves concentrated in a small number of countries, lithium provides an ideal environment to study the notion of criticality against the background of global vehicle electrification.
Overview of the lithium market
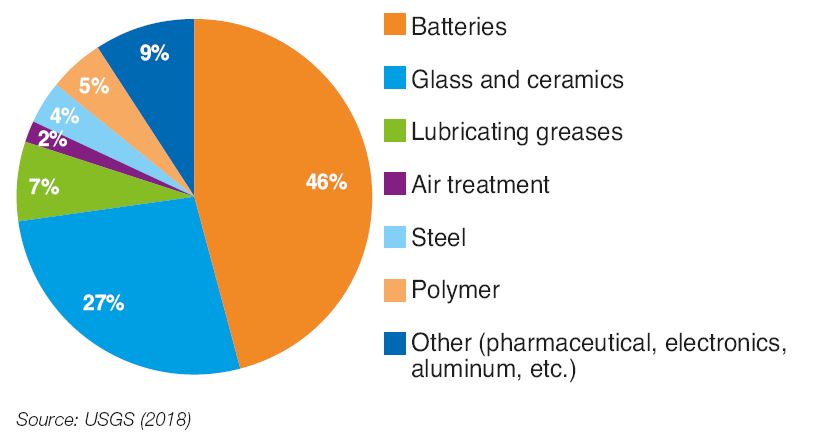
Lithium has historically been used in the glass and ceramics industries, for lubricating greases or in the production of aluminum. With the development of Li-ion technologies, it has also found a significant outlet in the battery sector, for portable electronic devices (such as mobile phones and laptops).
Production and resources
For 2017, lithium production was estimated at 45 kt15 lithium equivalent. The battery sector is now the primary outlet, with one-third of this lithium use applied to electric vehicles according to the International Energy Agency (IEA) (Fig. 2).
A positive growth has been observed in recent years for all sectors (except for the lubricating grease sector), especially batteries, where lithium consumption is increasing by about 20% per year. At the same time, trade flow has increased for the two main forms of lithium (carbonate and hydroxide)16. The largest importers and, ultimately, consumers, are the most active countries in the electronics sector (China, South Korea, United States, etc.) (Fig. 3).
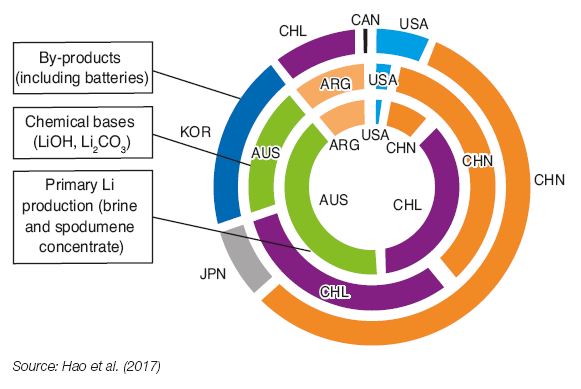
Nevertheless, although lithium use is concentrated in Asia and the United States, the geographic distribution of mining differs significantly. Most production of gross lithium (around 90%) comes from two regions: Australia and South America’s lithium triangle (Argentina – Bolivia17 – Chile). The Andean region holds more than 50% of global resources, estimated at 52.3 Mt18 (Fig. 4).
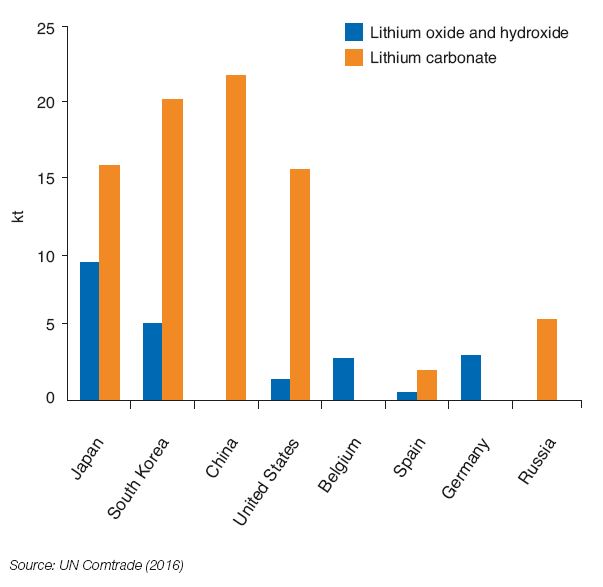
(in kt, 2016)
%20and%20primary%20production%20(solid%20line)%20worldwide%2C.JPG)
The geography of primary lithium production (brine, rock) can differ from that of chemical bases (LiOH, Li2CO3, etc.), and products using chemical derivatives of lithium, which require other processes for their production (such as lithium cathodes). A 2017 study of international lithium flow19 highlighted this dynamic in Australia and in China. While Australia is the largest supplier of primary lithium in the form of spodumene concentrate, refining is carried out in China to produce the chemical bases. Conversely, Chile exports a large majority of lithium produced in the country in the form of lithium carbonate (Fig. 5).
material), by country
|
The various lithium deposits 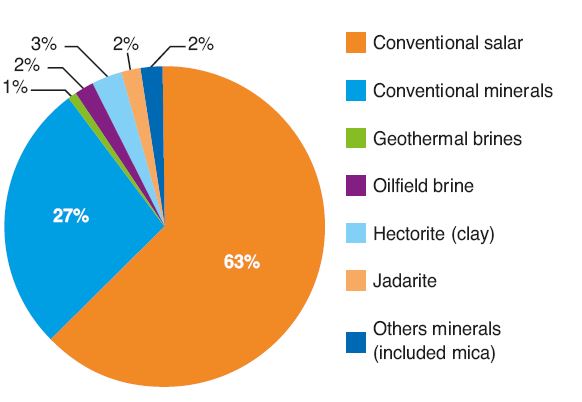
Exploitation of brine deposits is the main source of lithium, representing around 60% of supply. Mines from which lithium-bearing rocks are extracted represent 40% of production, most of which come from the Greenbushes mine in Australia. |
Market structure and price-setting
Lithium production is controlled by a small number of players. The largest industries are groups in the chemical, agri-food (with nitrogen fertilizers) and the pharmaceutical sectors, for which lithium represents only a few tens of percent of turnover20. Longstanding players, in the United States (Albemarle (formerly Rockwood) and FMC) and in Chile (SQM), extract lithium and transform it into high-purity carbonate or high value-added lithium composites. The two major Chinese companies, Tianqi and Ganfeng, have historically been processors and have only invested in the overall value chain in the past several years. In 2013, Tianqi acquired 51% of the shares of Talison in Australia (the other 49% is held by Albemarle). In addition to these companies, there are exploration companies, commonly known as “juniors”, which identify deposits and study the feasibility of their exploitation. While the three major longstanding players, FMC, SQM and Albemarle (the “Big Three”), still hold a little over 50% of the market share, during 2016 Chinese companies provided nearly 40% of the lithium supply, most of which is used for domestic consumption. Some juniors have also played their cards right, such as Lithium Americas, Orocobre and Galaxy Resources.
While three groups can be distinguished, depending on whether the actors considered produce and/or process lithium (producer-processors, producers alone and processors alone), today there is a trend toward integration throughout the value chain and consolidation of players, in order to capture maximum value and ensure, for a given player, a greater share of a rapidly growing market. With a limited number of players, the spot market remains relatively undeveloped except China. Most transactions take place through private supply contracts. However, the term of such contracts is decreasing: from one to three years, the average term has shortened to three to six months21, mainly due to volatile lithium prices (+ 47% average increase between 2015 and 2016 for contracts22 and up to +400 % on the Chinese spot market between January and May 201623), leading to the addition of new index clauses. At an international level, the lithium market remains geographically divided between an Atlantic market (Europe and the United States mainly supplying themselves from South America) and an Asian market (China with its domestic production and primary supply from Australia). This geographic division concerns both production and consumption, as well as market prices. A ton of lithium is currently around $1,000 more expensive on the Chinese market24 than on the American market. Likewise, prices in Europe are higher than those in the United States. This trend can be explained by the smaller number of consumer companies, and accordingly by lower volumes intended for the European market.
What impact will the transport sector have on lithium demand in 2050?
A prospective modeling exercise has been conducted using the TIAM (TIMES Integrated Assessment Model) model, which is a bottom-up partial equilibrium model25, operating under cost minimization. The model is divided into 16 regions and provides a detailed geographic analysis. The transport sector and the lithium industry have been modeled in order to study the impact of vehicle electrification on lithium resources (additional details about the model are set forth in the appendix).
The results used are derived from three scenarios, over a study period from 2005 to 2050, defined to observe the impact of the automotive technology profile in response to energy constraints and incentives, on the lithium market. The three scenarios are presented below26:
- BAU (Business As Usual): baseline scenario, current trend continues without any new measures being adopted in the future;
- BAU Factor 2 scenario and BAU Factor 4 scenario27: two-fold and four-fold decline in direct CO2 emissions in the transport sector compared to 2005 levels, in all global regions, by 205028.
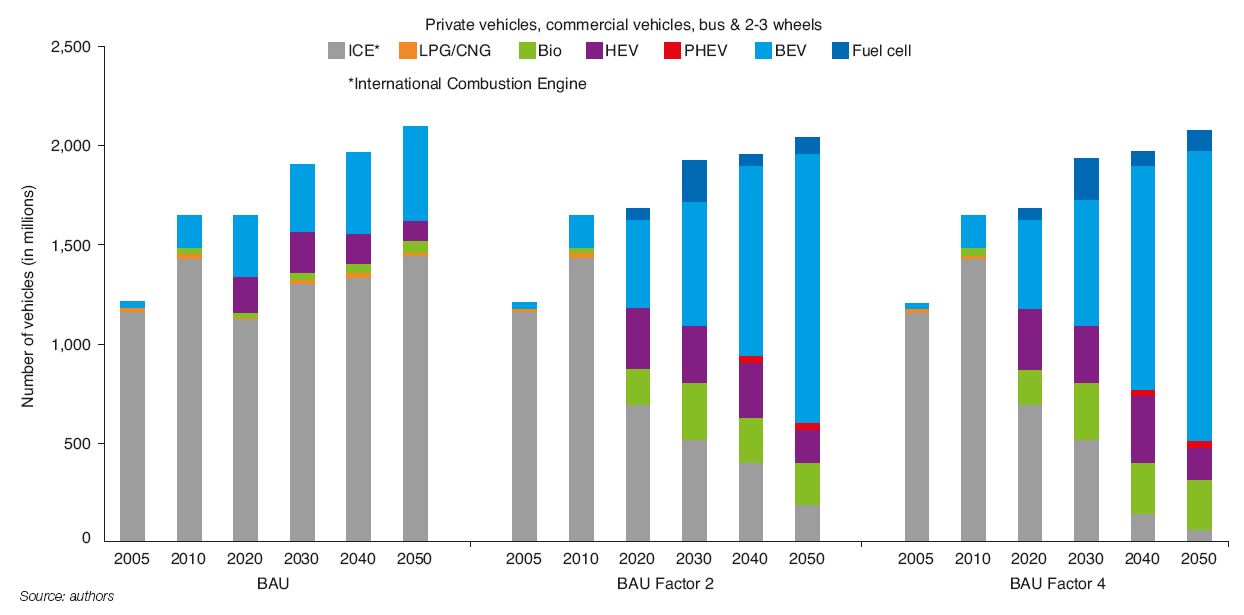
Figure 6 presents changes in the global vehicle fleet (including 2 and 3-wheel vehicles) by engine type, for the applicable scenarios. This results in a fleet of slightly more than two billion vehicles by 2050, across all scenarios. There is a preponderance of internal combustion vehicles (2/3 of the fleet) in the BAU scenario with gradual penetration of electric vehicles (EV). On the other hand, the internal combustion fleet falls to 9% and 3% of the global fleet respectively under the BAU Factor 2 and BAU Factor 4. In both scenarios, with highly ambitious CO2 emission reduction goals, use of battery-powered electric vehicles will rise sharply over the course of the study period (67% and 71% of the global fleet by 2050).
Note that most of the EV fleet is located in Asian countries (China, India and other developing countries in Asia). This is especially due to the large presence of 2 and 3-wheel electric vehicles that represent more than half of the global EV fleet.
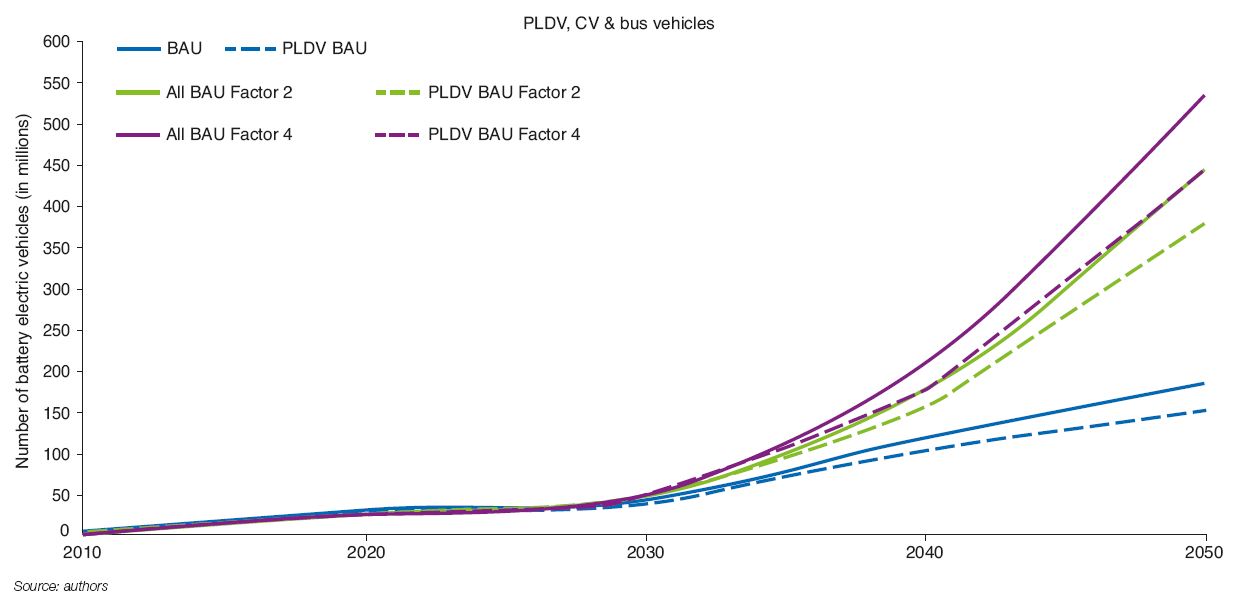
The global fleet of battery-electric vehicles (not including 2 and 3-wheel vehicles) should reach 40 to 50 million units by 2030 and between 200 and 650 million units by 2050 (Fig. 7, solid lines). When considering passenger light-duty vehicles (PLDVs) alone, they should reach 30 to 35 million units in circulation by 2030 and between 150 and 550 million units by 2050 (Fig. 7, dotted lines). These forecasts are similar in scope to the IEA’s forecasts in the Global EV Outlook 2017, which estimates the number of electric cars at between 60 and 200 million by 2030, depending on the scenario.
Impact of fleet electrification on future lithium consumption
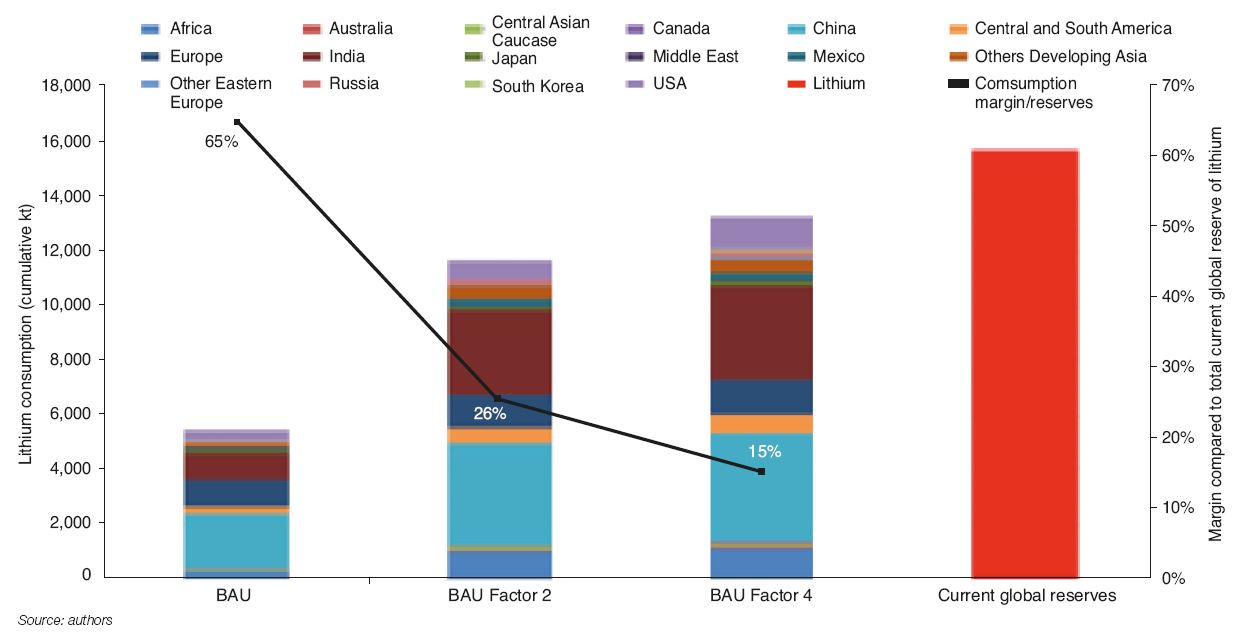
Changes in lithium consumption follow the same trend as the penetration of EV. Cumulative demand for lithium from 2005-2050 is estimated at between 6 and 13 million depending on the applicable scenario in our study (Fig. 8). Demand is driven globally by Asia (China and India) and Europe, with their respective shares estimated at approximately 30%, 26% and 10% of total consumption. High consumption by China and India results from the use of 2 and 3-wheel electric vehicles in addition to PLDVs. Africa is not lagging in this regard, with a significant portion (around 8%) of cumulative global lithium consumption due to the development of this electrical industry.
A comparison of cumulative lithium consumption between 2005 and 2050 compared with current reserves (16 Mt) provide information about the level of criticality of lithium. Figure 8 shows the reduction of the leeway between cumulative lithium consumption and the current level of reserves with the implementation of highly ambitious environmental goals in the transport sector: it is assessed at 65% in the BAU scenario while it is only 15% in the BAU Factor 4 scénario.
Uncertainty about supply despite adequate resources
The studied scenarios tend to show that no significant geological risk exists in the lithium market since, as with reserves, resources are substantial29 and it is likely that they will be technologically accessible by 2050, at least in part. In the short term, it is important to have time to react between supply and demand, which could lead to supply risk. According to company announcements in the mining sector, around ten new deposits will be exploited in 2018. According to figures announced by players in the lithium market, between 65 and 85 kt of lithium should reach the market between 2018 and 202030. In comparison with 2017 (45kt), production could thus rapidly double. In terms of key players, most of the credible announced projects exceed 15 kt LCE31/year and are driven in part by newer players such as Lithium Americas, Orocobre and Galaxy Resources. In the short terms, there is significant uncertainty surrounding production lead times, which are typically delayed for several years following producers’ announcements. Announced volumes often related to capacity rather than production volumes, which tend to overestimate future production. We have also seen a risk of surplus of lithium concentrates in the market, resulting from spodumene extraction, related to inadequate refining capacity for processing. If a bottleneck exists with regard to refining, and understanding the dynamics of current demand, the prices of chemical bases of lithium could sharply rise. Finally, uncertainty regarding the environmental impact of lithium production (high consumption of water in South America, for example) and the sensitivity of evaporation processes to weather conditions further highlight the lithium market’s vulnerability.
The decisive impact of national strategies within the lithium triangle
The lithium triangle, composed of Argentina, Bolivia and Chile, currently represents 55% of global resources and nearly 50% of production.
The region Central and South America will be the largest exporter of lithium by 2050 (Fig. 9). In a scenario where emissions in the transport sector are reduced four-fold, the region could represent 80% of worldwide production. However, national strategies vary widely at the present time. In Chile, deposit concession holders are subject to exploitation quotas and short-term leasing contracts. In Argentina, President Mauricio Macri’s current economic policy in favor of foreign direct investment (FDI) raises questions about the sustainability of projects, in a country where foreign economic involvement is a national concern that shifts with political change. Bolivia is a unique case in the commodities market: it has the world’s largest lithium resources, located in the Uyuni salt flats, but is not currently producing lithium. Even though there is no real convergence among these three major countries, their national policies are key to understanding the lithium market in the coming years.
The risk of China
China is a net importer of lithium and a net exporter of lithium-based chemicals and processed lithium products (such as lithium cathodes). China imports most of the resources it refines within its borders (including 75% of spodumene from Australia and 25% of brine from South America). A major player in the lithium sector with two significant companies, Tianqi Lithium and Ganfeng Lithium Co., Beijing has become the largest consumer of lithium and the largest producer of processed lithium.
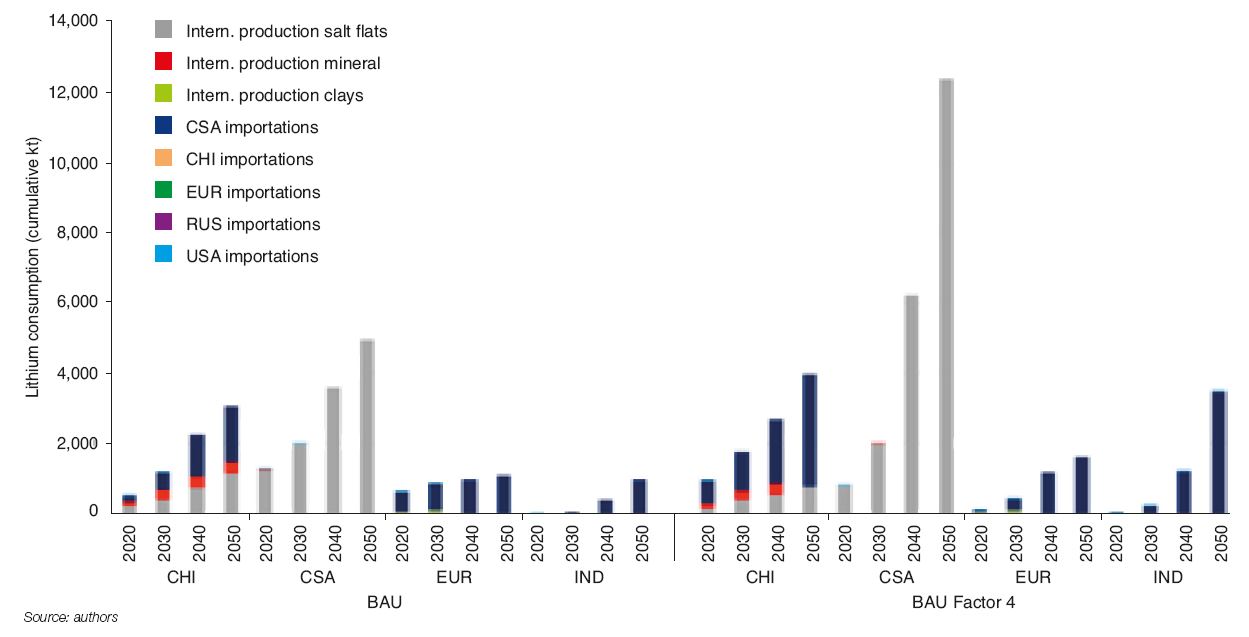
By 2050, China – like the United States and Europe – risks becoming predominantly dependent on imports from the lithium triangle (Fig. 9), which currently provides only around 15% of its current supply. However, China’s resources are fairly substantial (15% of global resources), even though their production costs are higher than in the salt flats. China has also completed multiple acquisitions and acquired interests in deposits, both in Australia and in the lithium triangle. In this context, changes in Chinese trade policy (establishment of quotas, embargo) must be analysed with respect to past transformations observed on other raw material markets (such as rare earths, etc.).
Uncertain development of the lithium market structure
Despite the presence of new players in the exploration sector, the lithium market remains dominated by a few companies, including Chinese companies. Given that instruments used to manage price volatility are not yet available on the commodities markets (LME)32, this concentration of players results in major uncertainty about future lithium prices. Price volatility may also weaken newcomers to the market and lead to further consolidation (mergers and acquisitions) among the players. Consolidations may also take place among companies further downstream in the value chain, such as the case of Toyota Tshucho Corp., which invested in the Argentinian company Orocobre Ltd. The lithium market remains small compared with the non-ferrous metals markets33. It is characterized by a lack of buffer stocks identified in the markets, which can lead to far more volatile price movements and reduced cyclicality. Shifting demand may therefore lead to sudden reactions by players and high intrinsic volatility on the markets.
However, it is important to note the relative role of the price of the commodity lithium in the overall cost of automobile
battery manufacturing. Bloomberg34 calculated that if the price of lithium tripled, it would only lead to a 2% increase in battery prices, while the increase would reach nearly 13% in the case of cobalt.
Conclusion
The scenarios developed in this study tend to show significant penetration of electric vehicles on a worldwide scale (up to 75% in 2050, all vehicles included) which could trigger a significant decline in the margin of lithium supply security (ratio between consumption and reserves). Global lithium reserves increased fourfold between 2005 and 2017 in response to the massive deployment of Li-ion battery technology (small electronics with portable batteries and the first phase of electric vehicle penetration since 2010). However, shifts in the long-term equilibrium of the commodities markets shows that a lack of geological criticality of resources does not conceal the various types of vulnerability, whether economic, industrial, geopolitical or environmental. Among them, competition among the players has to be considered, despite the arrival of new companies to the market. The industry’s structure tends to reveal the possibility of economic criticality, due to the low number of players and their oligopolistic position. National strategies within the lithium triangle also remain subject to substantial uncertainty, between economic openness and implementation of aggressive trade policies. In the coming years, it will be important to observe the strategic changes in each of these countries, given their share of global lithium reserves and their capacity to affect production supply. Finally, the policy of China and its companies, in the lithium industry as well as the batteries market, remains a key factor to understanding the future of the lithium market.
This study was financially supported by ADEME.
Final draft submitted in July 2018
APPENDIX
Description of the forward-looking analysis model
Description of the TIAM (TIMES Integrated Assessment Model) global model
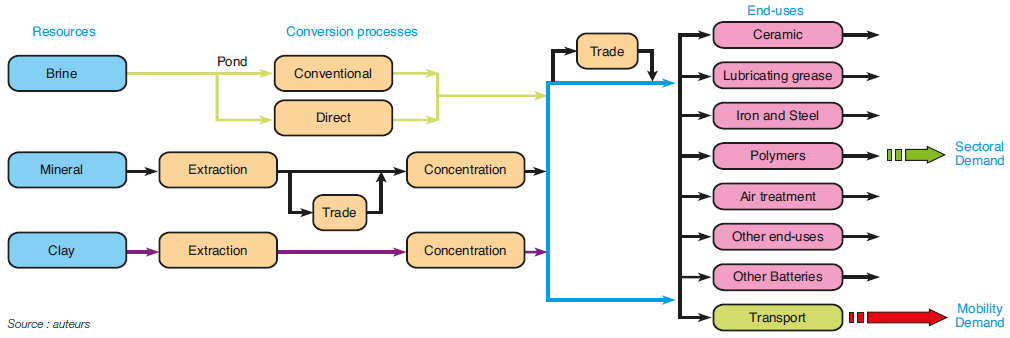
Analysis of lithium criticality requires a combination of regional and international analysis and a multisector integrated approach. The choice of this model provides an understanding of the economic, technological and geopolitical factors that may influence changes in the worldwide transport sector, on which the lithium market greatly depends. A prospective analysis has been conducted using the TIAM model. TIMES (The Integrated Markal-Efom System), successor to MARKAL (MARKet ALlocation), is a model generator with a bottom-up approach based on cost optimization. ETSAP35-TIAM is the global multiregional incarnation of the TIMES model generator. The entire energy system is represented in the TIAM model, covering energy resources and raw materials up to the end-use sectors, including the resource conversion sector (Fig.10). The objective function, which represents the total cost of the system calculated over the applicable period, is the criteria minimized by the model using linear programming.
TIMES is a partial equilibrium model. TIAM is subdivided into 16 regions36 each dedicated to an energy system and a specific transport sector. Each region can carry out exchanges of fossil resources, biomass, materials or emission permits, with other regions or within a centralized market. Within each region, the model describes all existing and future technologies, supply (raw materials) to demand, through the various conversion phases, as is the case for the lithium industry described in the model (Fig. 11).
In our model, we considered a value of 0.2 kg of lithium per kWh of battery37 with a shift to 0.15 kg/kWh by 2030. In this way, we obtain picture of the lithium market in 2050, based on electrification of the automobile fleet set forth above.
.PNG)
The transport sector in 2050
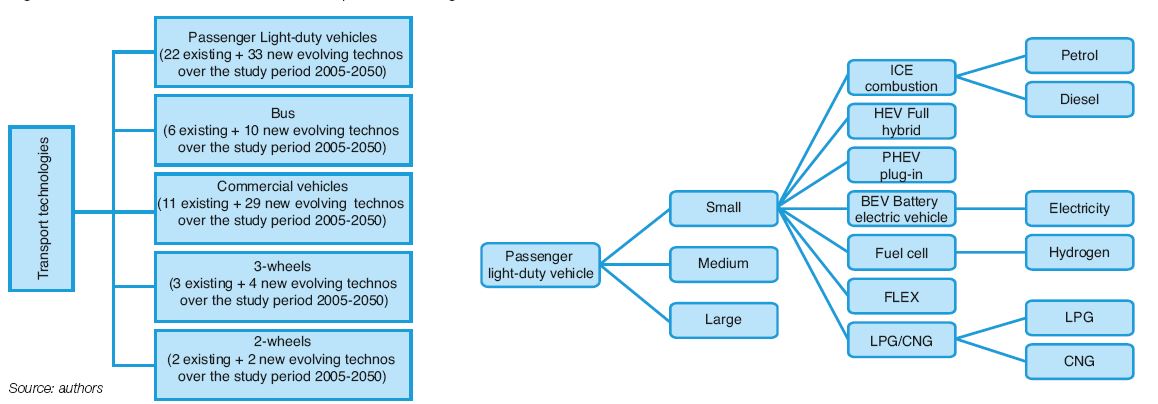
The transport sector has been divided into passenger light-duty vehicles (PLDV) (small, medium and large), bus, minibus, commercial vehicles (CV) (light, heavy and medium trucks) and 2 and 3-wheel vehicles (Fig. 12). The presentation of technologies relies on a specific understanding of the transport sector within each segment (PLDV, CV, bus and 2 and 3-wheels). Existing technologies are characterized by their inventory in thousands of vehicles. For all technologies across the entire study period 2005-2050, we took into account efficiency (consumption per mobility unit), average authors annual distance travelled, lifespan, cost (purchase cost, fixed and variable costs). These parameters, technical developments for the various engine types (combustion, hybrid, electric and technology mix) and changes in vehicle usage cost came from the use of IEA data on transport, and the BEAVeR38 and FSIM39 models developed by IFPEN.
(1) Electric vehicles include battery electric vehicles, plug-in hybrid vehicles and fuel cell electric vehicles. Electric cars refer here to the category of passenger light-duty vehicles
(2) International Energy Agency (IEA), Global EV Outlook 2018
(3) $200 billion in investment planned for 2020-2025, The automobile market: IFPEN dashboard no. 6
(4) Consumer of cobalt, lanthanum, lithium, etc.
(5) Consumer of platinum, palladium, rhodium, etc.
(6) Consumer of neodymium, dysprosium, terbium, etc.
(7) Consumer of titanium
(8) Consumer of cadmium, indium, gallium, etc.
(9) The production in the non-ferrous metals markets (copper, aluminium, nickel, etc.) can reach several Mt whereas minor metals generate production expressed in tons, hundreds of tons and occasionally thousands of tons
(10) i.e. involving significant economic consequences
(11) http://ec.europa.eu/growth/sectors/raw-materials/specific-interest/critical_fr
(12) Ibid
(13) For example chrome, used in the production of stainless steel and certain alloys, vanished from the European Union’s list of critical raw materials between 2014 and 2017. Chrome still has significant strategic importance, but the risk of supply disruption has lessened, due to diversification of supplier nations, especially with the emergence of China
(14) As with hydrocarbons, it is important to distinguish the terms “reserves” and “resources” when discussing minerals. “Resource” refers to the total existing volume of an existing ore, without considering the potential of present or future exploitation. “Reserves”, representing a subset of resources, corresponds to the technically and economically recoverable volume of a mineral. Thus, the notion of “reserve” is an economic concept, while “resources” are physical data. Estimates of reserves are dynamic and are periodically reassessed based on past production, technical advances, economic conditions, geological knowledge, etc.
(15) 43 kt according to USGS (2018), and an assumption of 2 kt for the United States based on mining company reports. This is equal to a reserve/production ratio of 355 years
(16) Analysis of trade flow data provided by UN Comtrade
(17) Bolivia is part of the lithium triangle, but is not currently producing lithium
(18) Figure provided and consolidated by the authors using aggregated data from USGS, BRGM and producers’ websites
(19 Tracing global lithium flow: A trade-linked material flow analysis, Resources, Conservation & Recycling, 124, (2017) 50–6
(20) Exploitation of salt flats enable these industrial players to produce potassium fertilizer, which supports their business (Rockwood and SQM annual reports)
(21) Interview Asian Metal, February 2017
(22) Benchmark Mineral Intelligence, on average prices for lithium carbonate contracts over the past two years
(23) Asian Metal 2017
(24) Ibid
(25) Thus, a single market can be studied, separate from the others. This means that a change in the supply and demand conditions in one market does not change the other markets, and that a change in conditions in other markets does not influence the market being studied, all things being otherwise equal
(26) The presented scenarios do not reflect reality, but are intended to trigger discussion about the risks associated with lithium resources. Scenarios with public policies are presented in the expanded version of this work
(27) Both scenarios assume an identical evolution until 2030, i.e. emissions reduction of 10% and 30% respectively by 2020 and 2030, compared with 2005 levels. Then, in the case of Factor 2, there is a decrease as follows: -40% and -50% in 2040 and 2050 respectively. Finally, for Factor 4, a greater environmental constraint: -60 % and –75 % for 2040 and 2050 respectively
(28) Two IEA scenarios, 2DS and B2DS, set forth in the 2017 ETP, are similar in terms of carbon emission reduction goals in the transport sector
(29) Note that global resources are estimated at more than 50 Mt of lithium, while reserves totaled 16 Mt in 2017. Reserves correspond to resources that are currently economically exploitable
(30) Based on company reports
(31) LCE: lithium carbonate equivalent. 15 kt LCE equivalent to approximately 3 kt Li
(32) The LME plans to propose new futures contracts including lithium, graphite and manganese (all three used in automobile batteries), starting in January 2019
(33) Production in the non-ferrous metals market (copper, aluminum, nickel, etc.) totals several Mt.
(34) Bloomberg 2017
(35) ETSAP (Energy Technology Systems Analysis Programme) is an organization created to manage, develop and organize models within the MARKAL family, founded in 1976 by the IEA (International Energy Agency)
(36) Africa, Australia-New Zealand, Canada, South and Central America, China, European Union, Central Asia-Caucasus, other Eastern European countries, Russia, India, Japan, Mexico, Middle East, other Asian developing countries, South Korea, United States
(37) Manufacturer data, NMC 622 battery
(38) BEAVeR is a TCO model which allows calculation and comparison of ownership and usage costs for various road vehicles, whether private vehicles, utility vehicles, buses or heavy trucks
(39) FSIM enables the study of dynamics in the private vehicle market, the impact of a wide range of instruments and public policies, and assesses the environmental impact of these policies. FSIM is based on individual behavior, in that it simulates changes in consumer behavior in response to changing economic conditions
You may also be interested in