04.12.2020
10 minutes of reading


Why be concerned about copper in the energy transition? A team from IFPEN’s Economics and Environmental Assessment Department anticipates that its consumption is set to soar over the period to 2050. In parallel, since the 2000s, China has been implementing a strategy aimed at securing supplies of a metal that is essential for many sectors across the global economy.
- Copper-intensive low-carbon technologies
- Where is copper found? Who produces it?
- What risks is copper exposed to?
- How can supply risks be reduced?
- Points to remember: all the key elements about copper in a video

(Podcast french version)
Copper-intensive low-carbon technologies
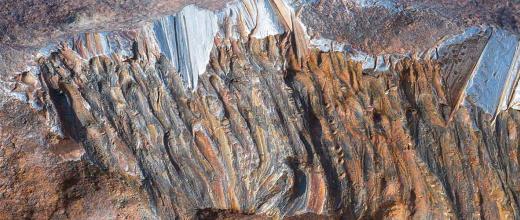
Due to its multiple properties – thermal and electrical conductivity, corrosion resistance – copper has become an essential metal in our modern societies. It is widely employed in the manufacture of electric cables and wires, plumbing, electronic equipment (printed circuits, electronic chips), in the transport sector (braking systems, injection systems, etc.), in buildings and for coin production.
But copper is attracting increasing attention as an essential material within the context of the energy transition. Copper intensity in low-carbon technologies – primarily the energy and transport sectors – is much higher than it is the case with more traditional energies (Graphs 1 & 2).
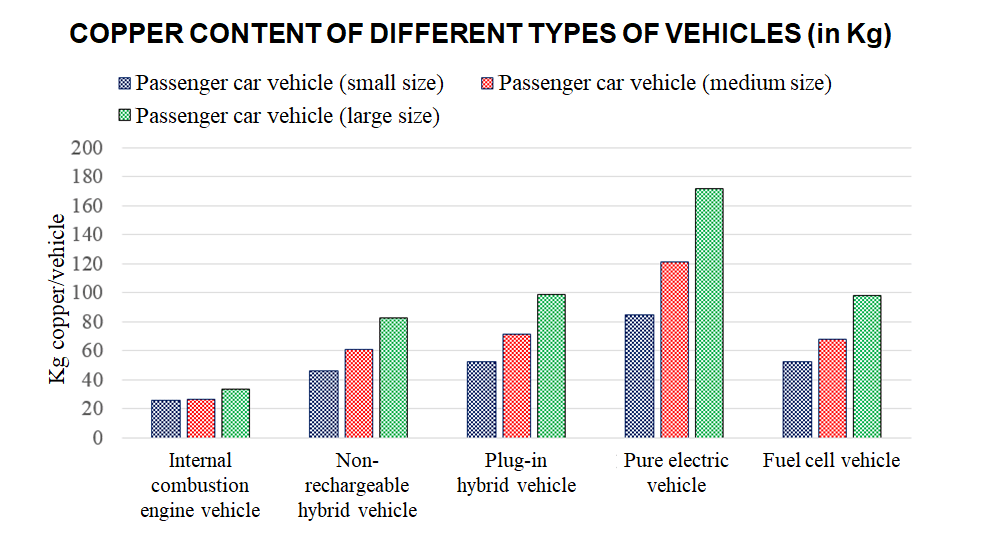
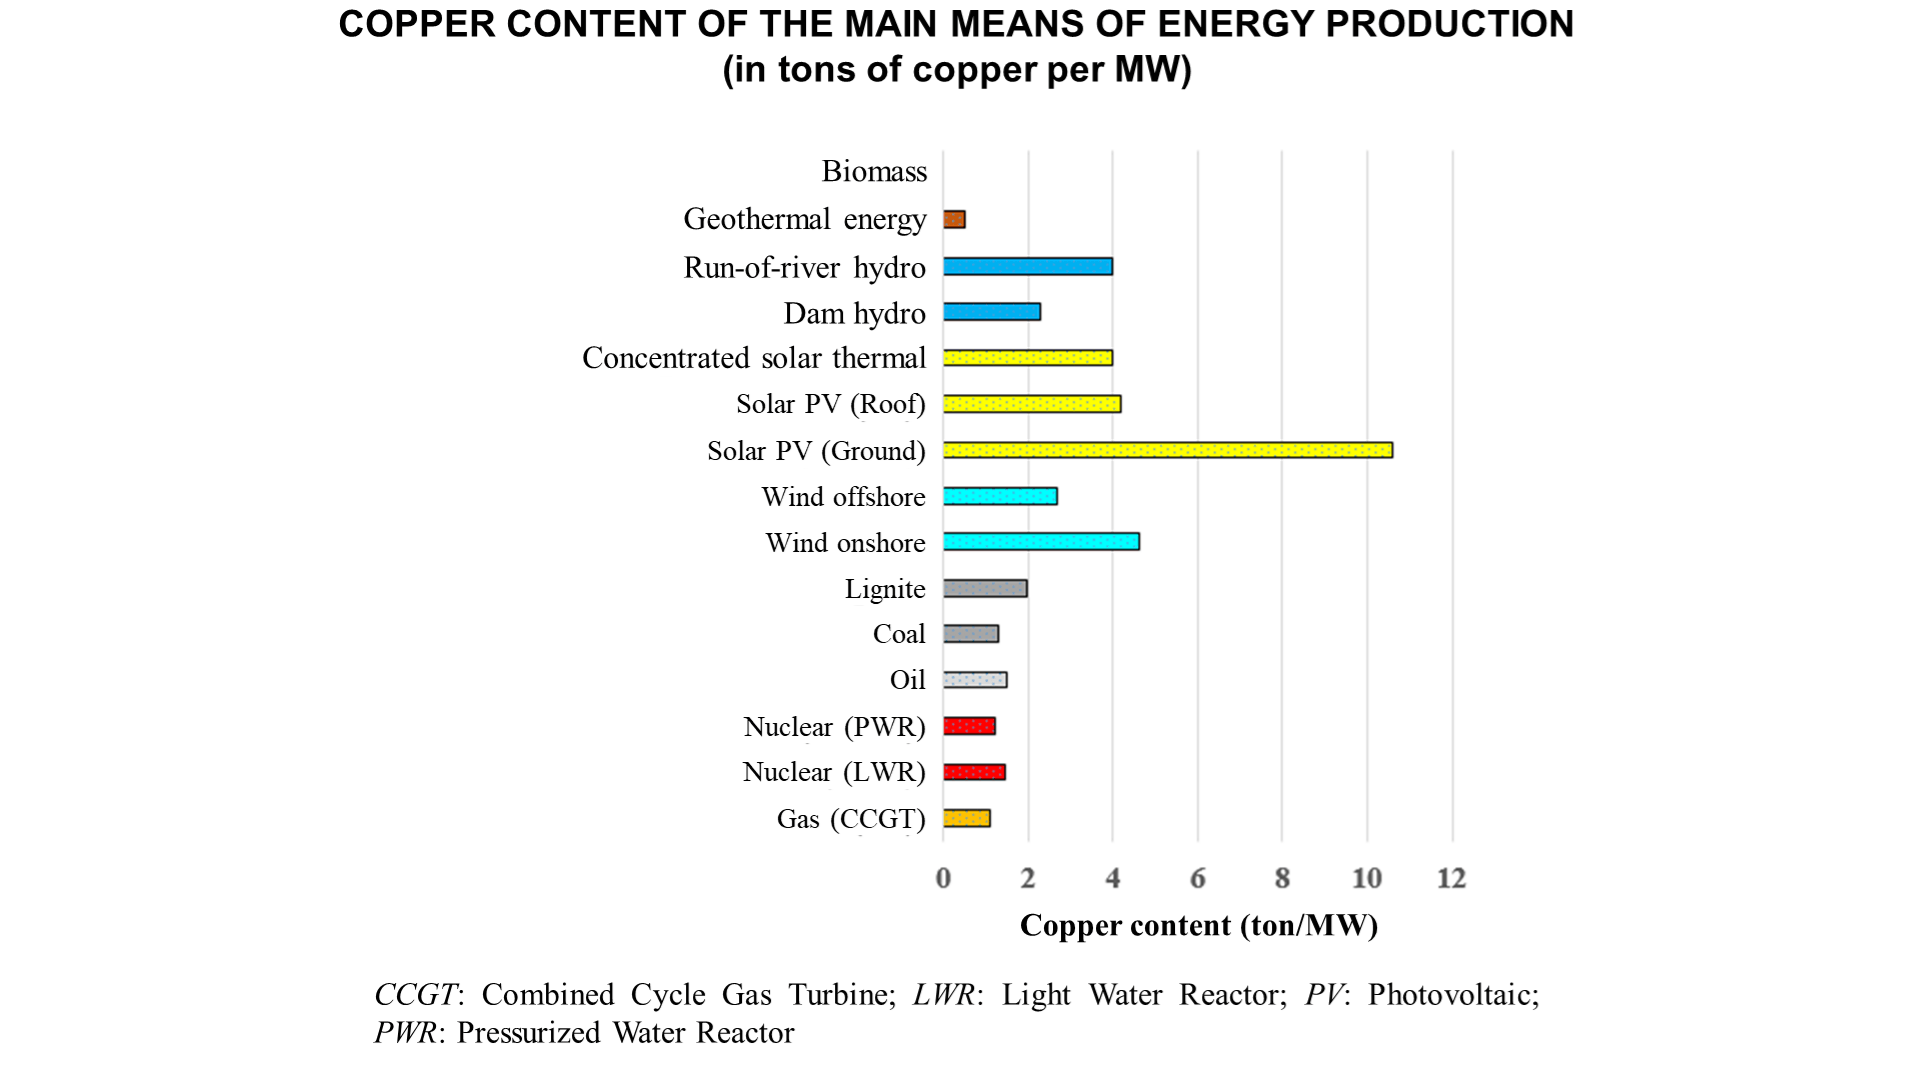
Source: Ecoinvent
Where is copper found? Who produces it? (Panorama)
Diversified location of copper resources and reserves
The U.S Geological Survey (USGS) estimates global copper resources to be 2.1 billion metric tons, to which can be added 3.5 billion tons yet to be discovered1 (average estimate) distributed throughout 11 regions of the world. Around half of these resources were located in South America, the southern part of Central Asia, Asia and North America (USGS, 2014).
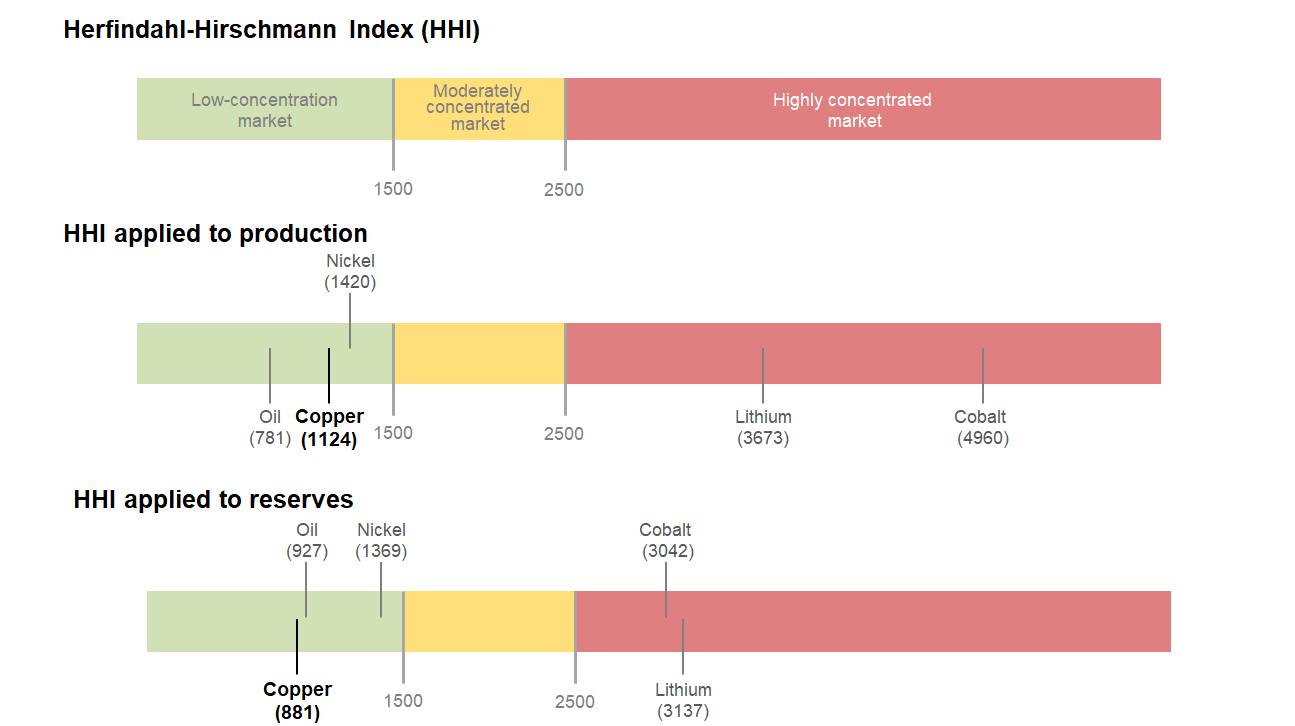
The HHI index (Herfindahl-Hirschmann Index) applied to copper reserves reflects their low level of concentration (Graph 4). 13 countries account for 75% of identified reserves (Graph 3). By way of comparison,12 countries account for 92% of cobalt reserves while 93% of lithium reserves are concentrated in just 9 countries.
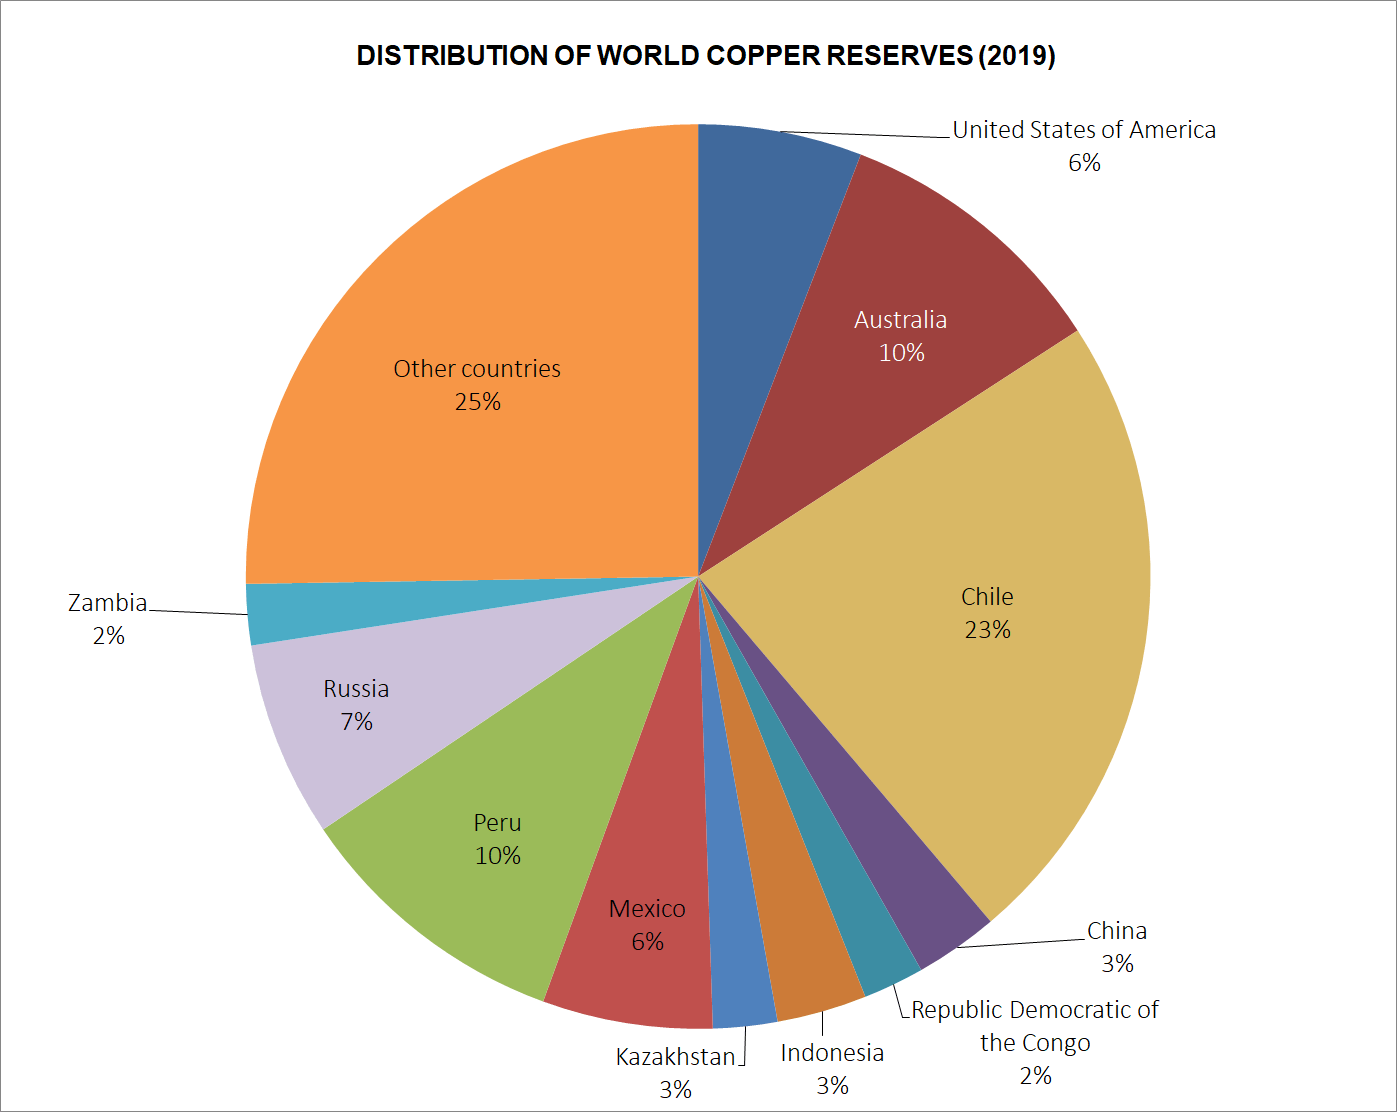
Source: USGS (2020)
Did you know? The Herfindahl-Hirschmann Index (HHI)
Definition: the Herfindahl-Hirschmann Index (HHI) measures market concentration. An index of between 1,500 and 2,500 corresponds to moderate market concentration whereas a value above 2,500 reflects a highly concentrated market.
Source data: calculations were conducted using data provided by the U.S Geological Survey in its Mineral Commodities Summaries (January 2020). The “Other Countries” category was not taken into account in the Herfindahl-Hirschmann Index calculation, resulting in a low index estimation.
(Source: Silberglitt et al., 2013)
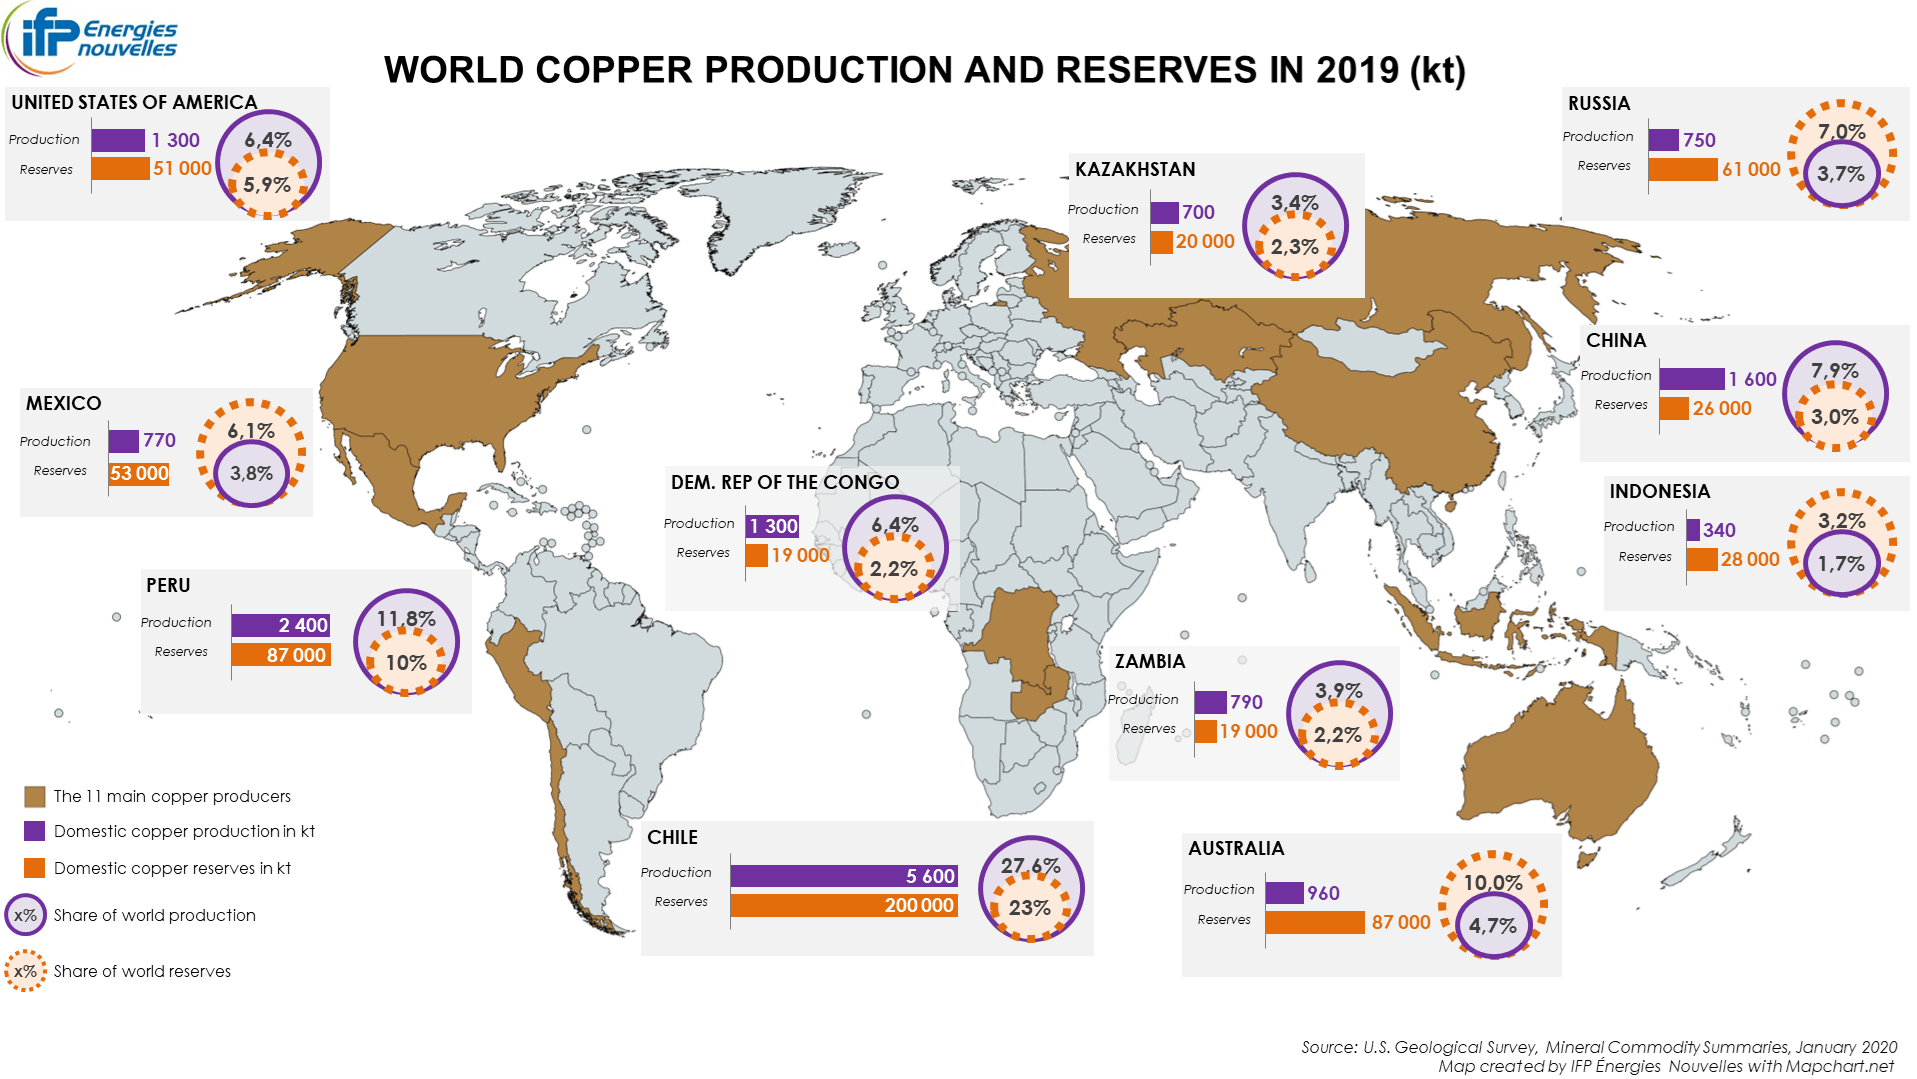
Chile and Peru, world copper production champions
In 2019, 20.3 million metric tons of copper were extracted worldwide. More than a quarter of this mining production came from Chile, around 12% from Peru and 8% from China (Map 1). Three counties thus accounted for more than 47% of global production.
More widely, 11 countries produced 73.7% of global copper in 2019, reflecting a relatively low concentration of extraction activities compared to other metals (Graph 4).
Source: USGS
In 2018, four of the ten biggest copper mines were located in Chile (Escondida, Collahuasi, El Teniente, Chuquicamata) and three in Peru (Cerro Verde II, Antamina and Las Bambas) (ICSG, 2019).
Source: USGS
What risks is copper exposed to?
A high degree of geological criticality
The research team used the TIAM-IFPEN model to evaluate the cumulative demand for copper for the period to 2050 on the basis of two climate scenarios: a 4°C scenario corresponding to a temperature increase of 4°C above pre-industrial levels (4D scenario) and a more ambitious climate scenario limiting the temperature rise to 2°C (2D scenario).
It then applied two mobility scenarios to each of these climate scenarios: the first, Business As Usual (BAU) mobility, corresponds to a continuous rise in vehicle ownership and an increased reliance on cars; the second promotes sustainable mobility via an integrated planning and investment approach related to regional development and urban transport, and the use of public and non-motorized transport.
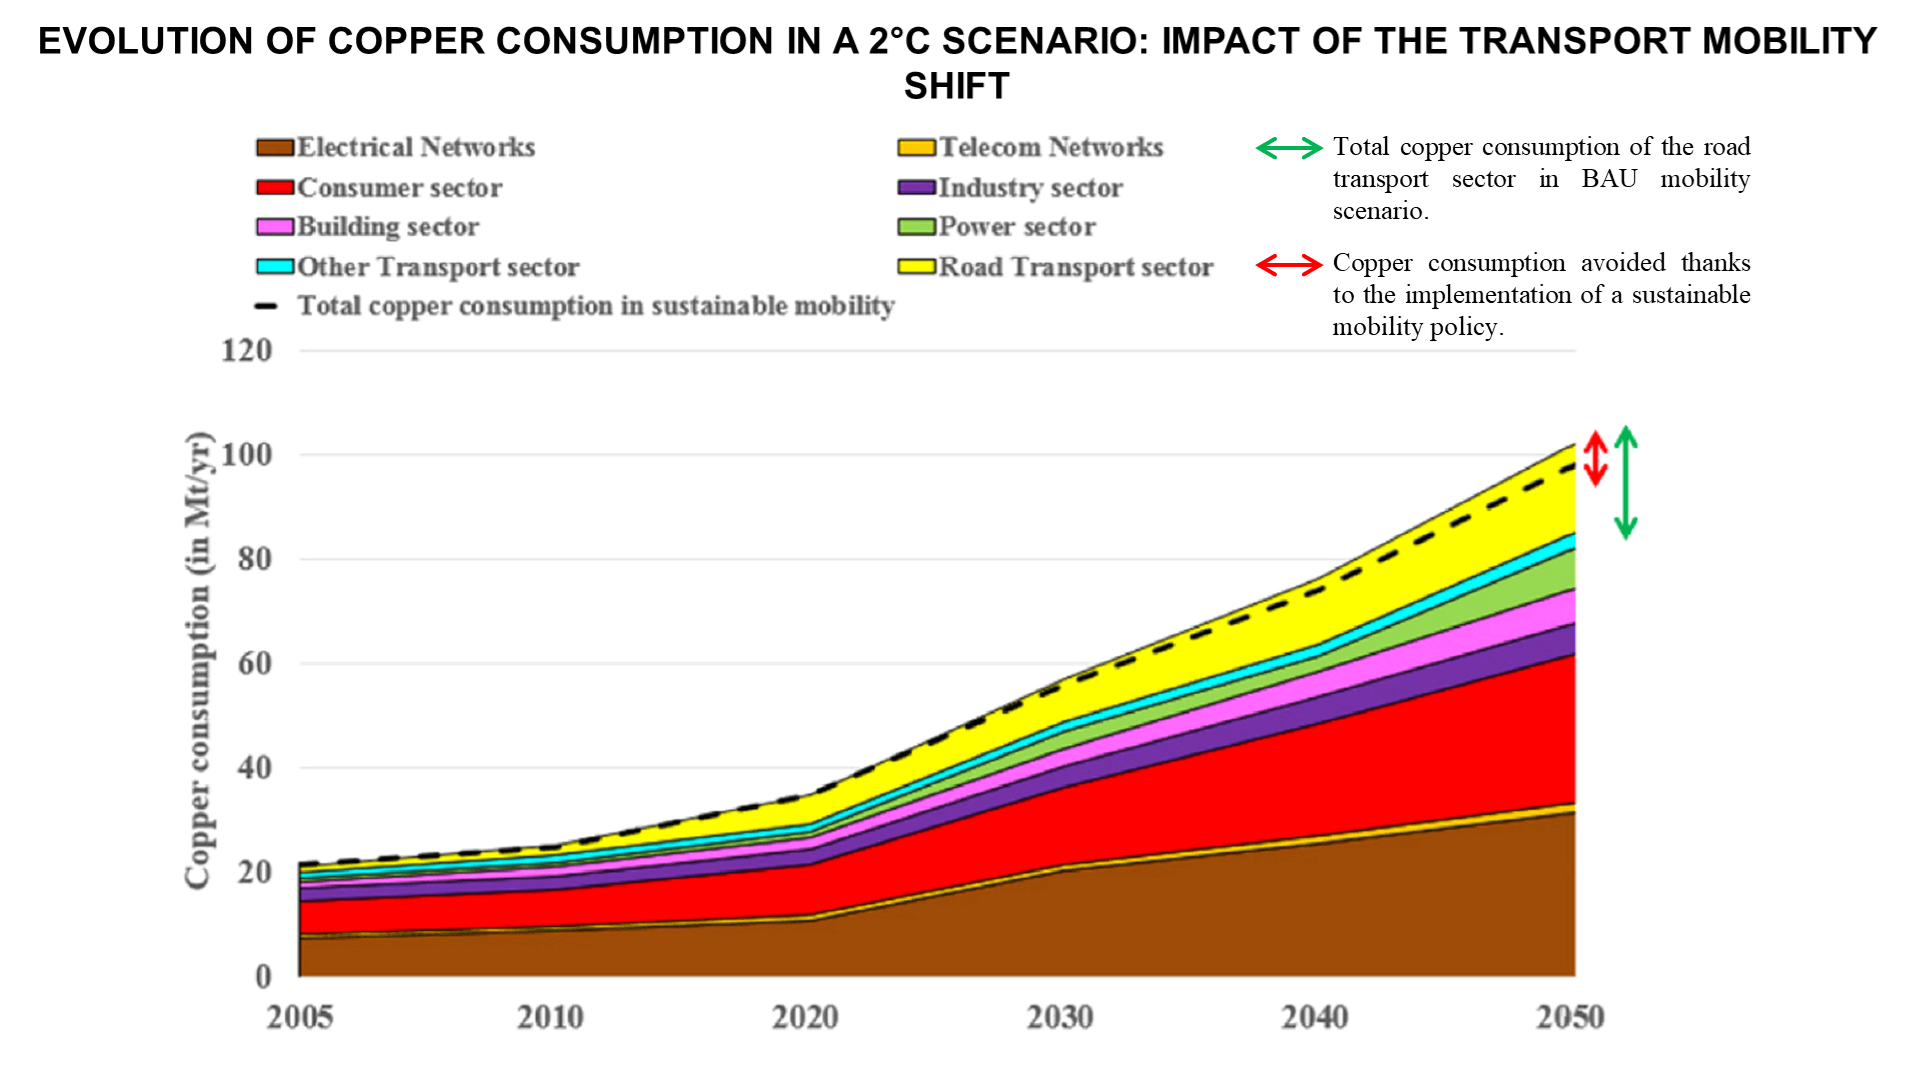
An explosion in demand for copper driven by the transport sector
The model anticipates an increase in the annual demand for copper: it rises from 27 Mt in 2015 to 86 Mt and 102 Mt respectively for the 4D and 2D scenarios in 2050 (BAU mobility). A demand primarily driven by the electricity network, consumer goods and transport sectors (Graph 8).
Irrespective of the scenario considered, the global electric vehicle fleet sees significant growth and is proportionally more marked in the ambitious climate scenarios.
Copper, a critical metal by 2050?
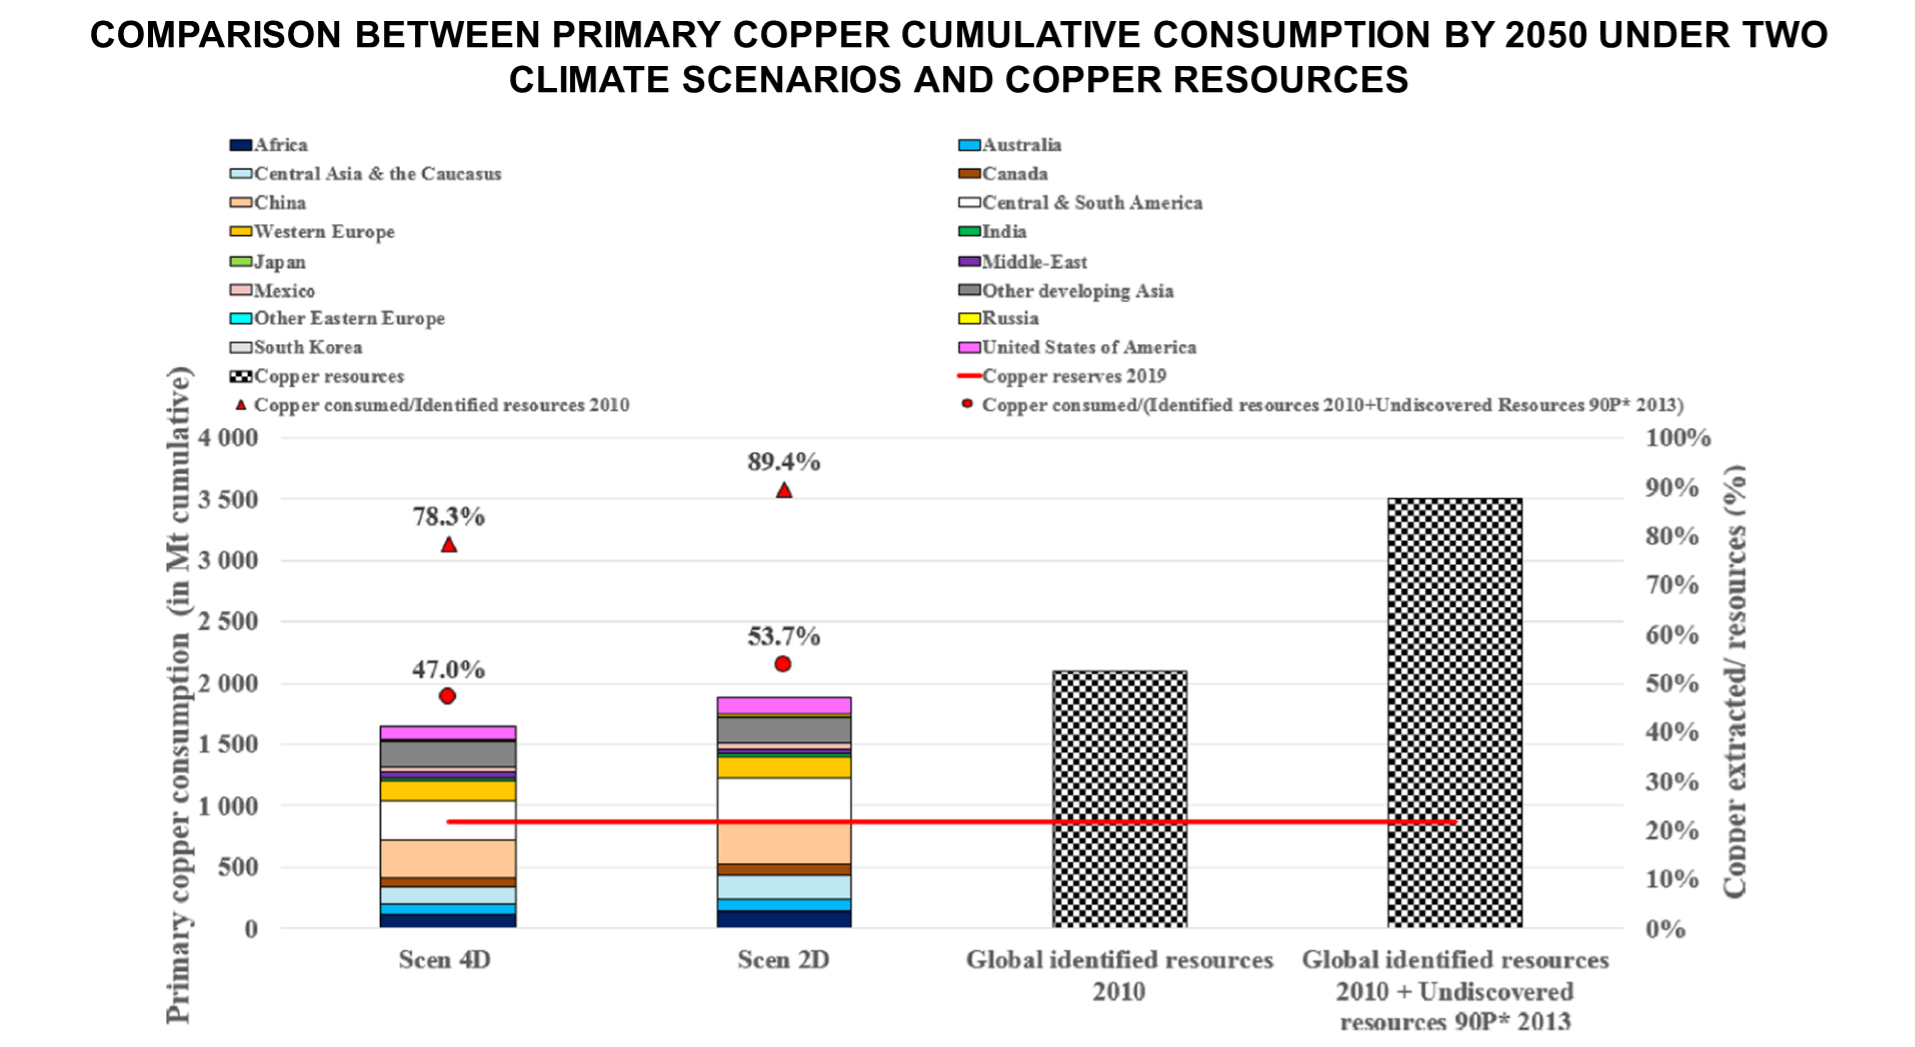
Two indicators are used to evaluate the criticality of copper and thus gauge the remaining safety margin at the relevant time point. They evaluate, firstly, the cumulative quantity of copper extracted from mines (primary production) and, secondly, the quantity consumed (final consumption) over the period 2010-2050 in relation to total copper resources.
The results obtained indicate significant pressure on copper resources, particularly within the framework of ambitious climate policies.
78.3% and 89.4% of identified global copper resources will be extracted in the 4°C and 2°C scenarios respectively between 2010 and 2050. These extraction figures fall to 47% and 53.7% respectively if undiscovered copper resources are available.
Source: IFPEN
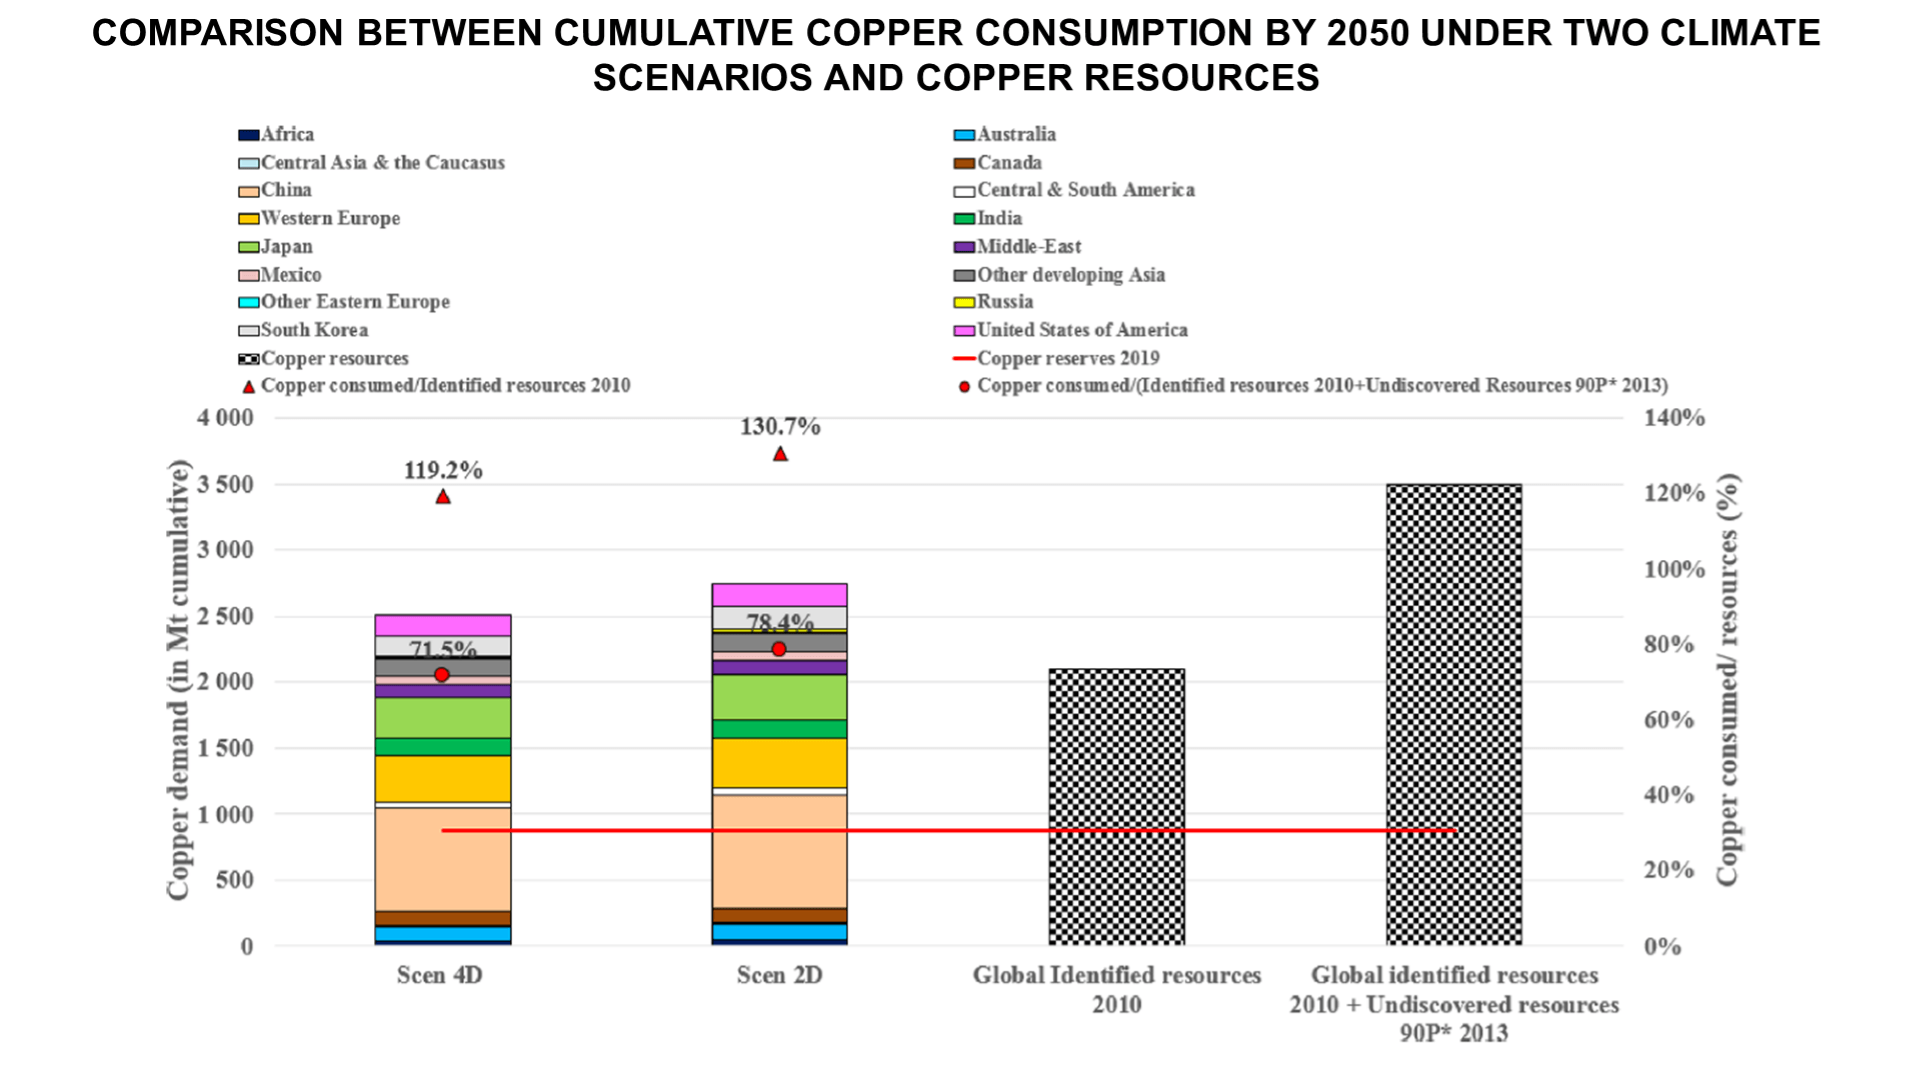
Without secondary production from recycling, the global demand indicator for copper related to resources amounts to 119.2% and 130.7% respectively in the 4°C and 2°C scenarios (with BAU mobility), which tends to demonstrate the importance of secondary production based on recycling for future market equilibrium.
Source: IFPEN
Increasing reliance on imports for Europe and China
Research also reveals that some zones are not producing enough to meet the needs of their economies. Europe and China are destined to become highly dependent on copper imports while Central and Southern America, Africa and the USA will produce enough to cover their domestic needs and even, in some cases, export a surplus. In this context, the copper market will remain dependent on the political and economic policy directions of the principal producing countries, particularly Chile and Peru, in the field of mining.
A Chinese stranglehold on the copper market?
Downstream of the market’s value chain is China where, in 2018, 9.4 million metric tons of copper were refined, i.e., 39% of the global total (around 24.1 million metric tons), while the country only represented 8% of mining production. China is thus very much the dominant force when it comes to copper refining activities.
In 2017, four of the five biggest copper refineries were operated by China . This situation represents a major change compared to the early 1990s, when the Americas and Europe dominated copper refining activities (ICSG, 2019). While China is the leading producer of the metal in its refined form, it is also the biggest consumer and has been since 2004. In 2017, 11.8 million metric tons of refined copper, i.e., 50% of the total, were consumed by China.
To secure its supplies, China turned to the market – in 2017, it accounted for more than 46% of global copper imports (UN Comtrade, 2017). Securing supplies became a major preoccupation in the early 2000s with the implementation of an economic and trade development strategy. Known as the “Go out strategy”, it enabled the country to reinforce its presence in Africa, Asia and Latin America via foreign direct investments (FDI) focusing primarily on the fields of infrastructures and mineral resources, or via so-called “Resources for infrastructures” deals (Konijn, 2014; Gulley, 2019).
The Belt and Road Initiative (BRI) introduced in 2013 was set up to enable Beijing to transport raw materials into China. In July 2019, the Chinese government estimated that 195 intergovernmental cooperation agreements had been signed with 136 countries across all continents2.
With 19 countries involved in the BRI, Latin America, with its wealth of raw materials, represents a preferential region in which to invest. Beijing has become the major importer of minerals and ore - iron and copper primarily - from South America and China has invested 35 billion dollars there since 2005. 18 billion dollars related to copper mining projects, of which 14 for Peru alone3.
1 Jiangxi Copper Corporation, Jinchuan Non-Ferrous Metal Corporation, Daye Non-Ferrous Metals Co. and Yunnan Copper Industry Group
2 “Six Years of Belt and Road”, Belt and Road Portal, 2019.
3 Numerous Peruvian copper mines are now in the hands of Chinese companies: Las Bambas, Toromocho, Galeno, Pampa del Pongo and the Rio Blanco mine. China is thus thought to control one third of the country’s mining sector (Küblböck et al., 2020).
Energy-intensive mining activities with significant environmental impacts
Since the start of the 20th century, the mining sector has seen a reduction in the concentration of copper ore (Mudd et al., 2013). More ore needs to be extracted, therefore, in order to obtain a given quantity of copper, which means consuming more energy and water and ultimately affects production costs.
For example, in 2019, the Chilean government decided to gradually reduce water extraction permits and to stop granting new ones for high water stress regions. These new constraints encouraged water desalination activities, an energy-intensive process. This water then has to be transported hundreds of miles in order to reach mining sites, some of which are located at altitude.
Paradoxically, therefore, protecting a resource leads to a proliferation of infrastructures (desalination plants and water transport networks) as well an increase in energy consumption in a sector where the quest for energy efficiency is already a major challenge. By way of illustration, in 2016, copper extraction activities in Chile accounted for 9% of the country’s national energy consumption (International Copper Association, 2017).
Finally, other environmental and social problems are caused by or at least correlated with mining activities, starting with environmental pollution generated by untreated mining industry waste.
For example, the production of 10,000 metric tons of refined copper in China gives rise to 127.72 tons of mining waste, 2 tons of foundry slag, 30 kg of heavy metal flue gases and harmful gas emissions such as CO2 and SO2 (Li et al., 2017).
How can supply risks be reduced?
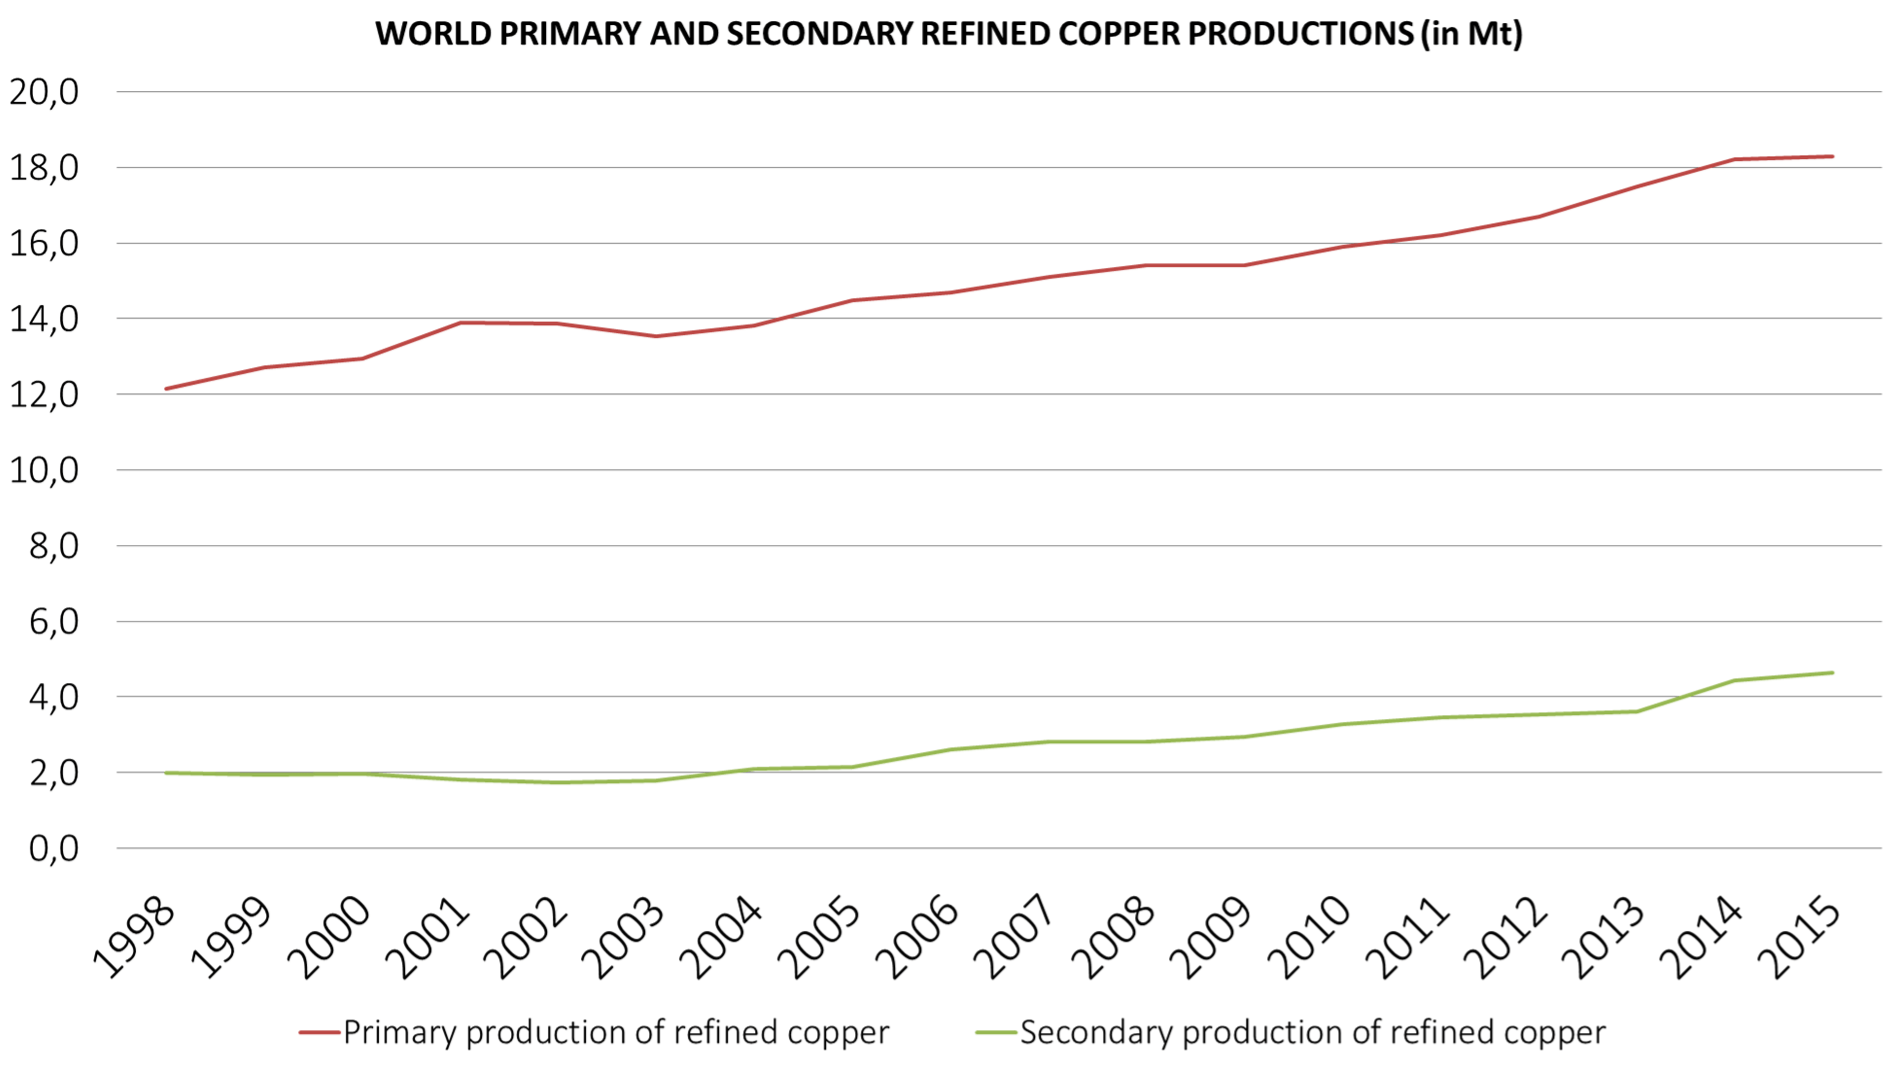
Recycling, an essential component but one that is limited by structural factors
While the secondary production of refined copper increased between 1998 and 2015, both in terms of volume and percentage (Graph 7), it grew less quickly than the waste stock. Theoretically, however, 100% of copper can be recycled.
There are two reasons for this: in sectors with the highest levels of recycling (construction and infrastructure), much of the associated copper is immobilized for several decades due to the lifespan of the buildings/infrastructures in question. In contrast, consumer goods, which have a much shorter lifespan, are only recycled at rates of between 25 and 40%. Moreover, the dispersive usages of copper make it more expensive and less attractive to recycle. The growth potential for copper recycling thus appears to be limited in the absence of a government incentive policy for the sector.
Source: USGS
The latter will have to remove uncertainties regarding the difficulties currently faced by the recycling sectors: dispersive usage and eco-design of products, cost of collection related in particular to the geographic scattering of sources, consumer behavior in terms of waste management and the often lengthy period of source immobilization.
Nevertheless, recycling remains a relevant solution within the energy transition process: it makes it possible to at least partially address the issue of supply security; it is also a means for industry to reduce costs; lastly, it helps mitigate the environmental impacts of metal production (Table 1).
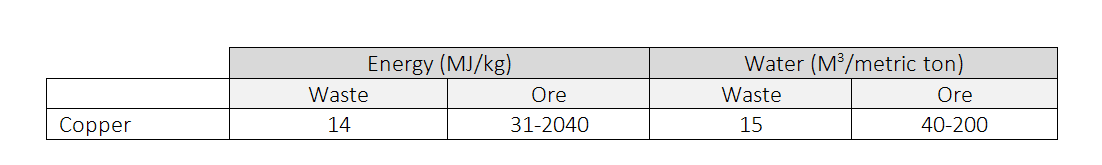
Source: Sverdrup and Koca, 2016
Less copper in transport: the sustainable mobility lever
Intervening in the transport sector via the implementation of sustainable mobility policies would make it possible to reduce the cumulative global demand for copper by 2050 by 2.3% in a 2D scenario (Graph 8). While the figure may appear small relative to the global problem, it is highly differentiated geographically, varying between 2 and 20%. For example, around 18% of consumption in Africa and Central Asia and close to 7% of that of India could be avoided by 2050 with the implementation of a sustainable mobility policy.
Source: IFPEN
Points to remember
The low-carbon technologies employed in the electricity generation and transport sectors use more copper than more conventional energies.
The risks this metal is exposed to are multiple:
- geological: with the expected significant growth in the demand for copper, IFPEN studies estimate that 78.3% and 89.4% of known resources in 2010 will have been extracted from mines by 2050 for the 4D and 2D scenarios;
- economic: China controls almost 40 % of the refining activities ;
- geostrategic: China is reinforcing its presence in Asia, Africa and Latin America and securing its supplies ;
- environmental: due to the decline in concentration of copper ore, its extraction is increasingly energy and water intensive ;
- social: the production generates numerous externalities (mining waste, landscape destruction).
To find out more
Metals in the energy transition
Copper at the crossroads: Assessment of the interactions between low-carbon energy transition and supply - Science Direct
Find all the points on this video:
>> BIBLIOGRAPHY
Scientific contacts : Emmanuel Hache, Charlène Barnet, Gondia Seck
To quote from this article: Hache, Emmanuel ; Barnet, Charlène ; Seck, Gondia-Sokhna «Copper in the energy transition: an essential, structural and geopolitical metal!», Metals in the energy transition, n° 2, IFPEN, December 2020.

You may also be interested in
Aluminium in the energy transition: what lies ahead for this indispensable metal of the modern world?
Nickel in the energy transition: why is it called the devil’s metal?
Lithium in the energy transition: more than a resource issue?
Rare earths in the energy transition: what threats are there for the “vitamins of modern society”?

Cobalt in the energy transition: a closer look at supply risks